Download
1 / 1
20 likes | 165 Views
Spectroscopic Image Signature Classification of Land Cover Types using Multi-Spectral Data within a Neural Network . Team Members: Charniece Huff (Spelman College), Bernard Aldrich Jr. (Jackson State University) Mentor: Je’aime Powell (Elizabeth City State University). METHODS Field Work

E N D
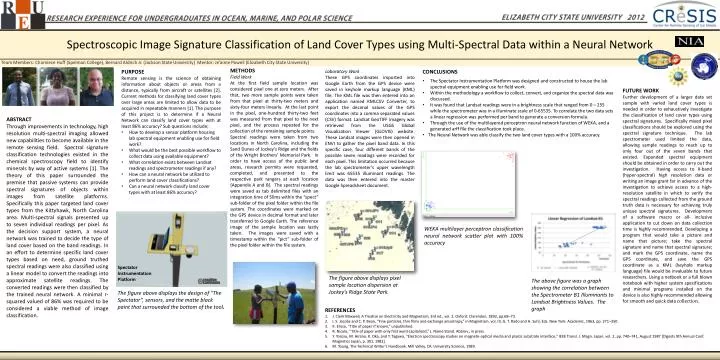
Spectroscopic Image Signature Classification of Land Cover Types using Multi-Spectral Data within a Neural Network Team Members: Charniece Huff (Spelman College), Bernard Aldrich Jr. (Jackson State University) Mentor: Je’aime Powell (Elizabeth City State University) METHODS Field Work At the first field sample location was considered pixel one at zero meters. After that, two more sample points were taken from that pixel at thirty-two meters and sixty-four meters linearly. At the last point in the pixel, one-hundred thirty-two feet was measured from that pixel to the next pixel, and the process repeated for the collection of the remaining sample points. Spectral readings were taken from two locations in North Carolina, including the Sand Dunes of Jockey’s Ridge and the fields of the Wright Brothers’ Memorial Park. In order to have access of the public land areas, research permits were requested, completed, and presented to the respective park rangers at each location {Appendix A and B}. The spectral readings were saved as tab delimited files with an integration time of 50ms within the “spect” sub-folder of the pixel folder within the file system. The coordinates were marked on the GPS device in decimal format and later transferred to Google Earth. The reference image of the sample location was lastly taken. The images were saved with a timestamp within the “pict” sub-folder of the pixel folder within the file system. • PURPOSE • Remote sensing is the science of obtaining information about objects or areas from a distance, typically from aircraft or satellites [2]. Current methods for classifying land cover types over large areas are limited to allow data to be acquired in repeatable manners [1]. The purpose of this project is to determine if a Neural Network can classify land cover types with at least 86% accuracy? Sub questions include; • How to develop a sensor platform housing lab spectral equipment enabling use for field work? • What would be the best possible workflow to collect data using available equipment? • What correlation exists between Landsat readings and spectrometer readings if any? • How can a neural network be utilized to perform land cover classifications? • Can a neural network classify land cover types with at least 86% accuracy? • CONCLUSIONS • The Spectator Instrumentation Platform was designed and constructed to house the lab spectral equipment enabling use for field work. • Within the methodology a workflow to collect, convert, and organize the spectral data was discussed. • It was found that Landsat readings were in a brightness scale that ranged from 0 – 255 while the spectrometer was in a illuminate scale of 0-65535. To correlate the two data sets a linear regression was performed per band to generate a conversion formula. • Through the use of the multilayered perceptron neural network function of WEKA, and a generated arff file the classification took place. • The Neural Network was able classify the two land cover types with a 100% accuracy. Laboratory Work These GPS coordinates imported into Google Earth from the GPS device were saved in keyhole markup language (KML) file. The KML file was then entered into an application named KMLCSV Converter, to export the decimal values of the GPS coordinates into a comma separated values (CSV) format. Landsat GeoTIFF imagery was retrieved from the USGS Global Visualization Viewer (GLOVIS) website. These Landsat images were then opened in ENVI to gather the pixel band data. In this specific case, four different bands of the possible seven readings were recorded for each pixel. This limitation occurred because the lab spectrometer’s upper wavelength limit was 65535 illuminant readings. The data was then entered into the master Google Spreadsheet document. FUTURE WORK Further development of a larger data set sample with varied land cover types is needed in order to exhaustively investigate the classification of land cover types using spectral signatures. Specifically mixed pixel classifications should be explored using the spectral signature technique. The lab spectrometer used limited the data, allowing sample readings to reach up to only four out of the seven bands that existed. Expanded spectral equipment should be obtained in order to carry out the investigation. Having access to X-band (hyper-spectral) high resolution data or writing an image grant far in advance of the investigation to achieve access to a high-resolution satellite in which to verify the spectral readings collected from the ground truth data is necessary for achieving truly unique spectral signatures. Development of a software macro or all- inclusive application to cut down on data collection time is highly recommended. Developing a program that would take a picture and name that picture; take the spectral signature and name that spectral signature; and mark the GPS coordinate, name the GPS coordinate, and save the GPS coordinate as a KML (keyhole markup language) file would be invaluable to future researchers. Using a netbook or a full blown notebook with higher system specifications and minimal programs installed on the device is also highly recommended allowing for smooth and quick data collection. ABSTRACT Through improvements in technology, high resolution multi-spectral imaging allowed new capabilities to become available in the remote sensing field. Spectral signature classification technologies existed in the chemical spectroscopy field to identify minerals by way of active systems [1]. The theory of this paper surrounded the premise that passive systems can provide spectral signatures of objects within images from satellite platforms. Specifically this paper targeted land cover types from the Kittyhawk, North Carolina area. Multi-spectral signals presented up to seven individual readings per pixel. As the decision support system, a neural network was trained to decide the type of land cover based on the band readings. In an effort to determine specific land cover types based on need, ground truthed spectral readings were also classified using a linear model to convert the readings into approximate satellite readings. The converted readings were then classified by the trained neural network. A minimal r-squared valued of 86% was required to be considered a viable method of image classification. WEKA multilayer perceptron classification neural network scatter plot with 100% accuracy Spectator Instrumentation Platform The figure above displays the design of "The Spectator”, sensors, and the matte black paint that surrounded the bottom of the tool. • REFERENCES • J. Clerk Maxwell, A Treatise on Electricity and Magnetism, 3rd ed., vol. 2. Oxford: Clarendon, 1892, pp.68–73. • I. S. Jacobs and C. P. Bean, “Fine particles, thin films and exchange anisotropy,” in Magnetism, vol. III, G. T. Rado and H. Suhl, Eds. New York: Academic, 1963, pp. 271–350. • K. Elissa, “Title of paper if known,” unpublished. • R. Nicole, “Title of paper with only first word capitalized,” J. Name Stand. Abbrev., in press. • Y. Yorozu, M. Hirano, K. Oka, and Y. Tagawa, “Electron spectroscopy studies on magneto-optical media and plastic substrate interface,” IEEE Transl. J. Magn. Japan, vol. 2, pp. 740–741, August 1987 [Digests 9th Annual Conf. Magnetics Japan, p. 301, 1982]. • M. Young, The Technical Writer's Handbook. Mill Valley, CA: University Science, 1989. The figure above displays pixel sample location dispersion at Jockey’s Ridge State Park. The above figure was a graph showing the correlation between the Spectrometer B1 Illuminants to Landsat Brightness Values. The graph