Download
1 / 50
500 likes | 631 Views
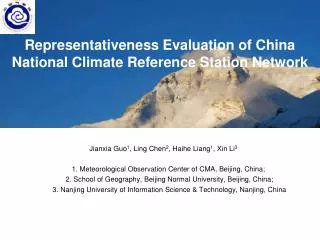
Comparing Climate and Weather A Model U.S. Climate Reference Network Station. ESIP Federation Summer Meeting, July 12, 2011. LuAnn Dahlman NOAA Climate Program Office. 1971 — Annual 4 th of July Picnic — Minneapolis, Minnesota. July. 4. 5. 1. 2. 3. 4. 5. Hi: 84 Lo: 66 Pcp : 0.

E N D
Comparing Climate and WeatherA Model U.S. Climate Reference Network Station ESIP Federation Summer Meeting, July 12, 2011 LuAnn Dahlman NOAA Climate Program Office
July 4 5 1 2 3 4 5 Hi: 84 Lo: 66 Pcp: 0 Hi: 82 Lo: 61 Pcp: 0 9 6 7 10 11 12 8 6 8 9 7 10 11 12 Hi: 86 Lo: 66 Pcp: 0 Hi: 82 Lo: 61 Pcp: 0 Hi: 74 Lo: 36 Pcp: 0 Hi: 72 Lo: 45 Pcp: 0 Hi: 74 Lo: 44 Pcp: 0 Hi: 64 Lo: 58 Pcp: 0.09” Hi: 62 Lo: 58 Pcp: 0.61” 14 15 16 17 13 19 18 14 15 16 17 18 19 13 Hi: 84 Lo: 68 Pcp: 0 Hi: 81 Lo: 66 Pcp: 0 Hi: 85 Lo: 66 Pcp: 0 Hi: 85 Lo: 68 Pcp: 0 Hi: 86 Lo: 64 Pcp: 0 Hi: 82 Lo: 61 Pcp: 0 Hi: 82 Lo: 61 Pcp: 0 20 21 22 23 24 25 26 28 29 30 31 27
What has Charlie been measuring for 30 years? Climate Climate and Weather Weather
What is Charlie calculating? Climate Climate and Weather Weather
Climate normals for Minneapolis, 1971 - 2000 Compared to 2010 weather
Climate normals for Minneapolis, 1971 - 2000 Compared to 2009 weather
Climate normals for Minneapolis, 1971 - 2000 Compared to 2008 weather
Multigraph Climate Explorer http://climateexplorer.multigraph.org
Climate normals for Minneapolis, 1971 - 2000 Historically, three consecutive decades of weather observations have been used to describe climate
Now anticipating release of 30-year Climate Normals for 1981 – 2010 For Minneapolis, January minimums have increased by almost 3°F July maximums have decreased by about 0.5°F
Weatheris what’s happening outside your window Atmospheric conditions that you can see, feel, or measure are weather.
Temperature Statistics Climate can be described by words or numbers, but you cannot touch it Temperature Statistics Dynamic normals based on fewer than 30 years are also being used to make comparisons
Temperature Statistics And though climate is often characterized by temperature alone… Temperature Statistics
Climate? or Weather? Decide if each of the following phrases describes climate or weather.
Climate? or Weather? Tells us what kind of clothes to wear
Climate? or Weather Tells us what kind of clothes to wear
Climate? or Weather? Tells us what kind of clothes to buy
Climate? or Weather? Tells us what kind of clothes to buy
Climate? or Weather? The picture that comes to your mind when you think of a faraway place
Climate? or Weather? The picture that comes to your mind when you think of a faraway place
Climate? or Weather? California usually has a winter storm during the last week of December
Climate? or Weather? California usually has a winter storm during the last week of December
How reliable do you think our weather records are for characterizing climate? A-Not reliable B-Somewhat reliable C-Very reliable D-Extremely reliable
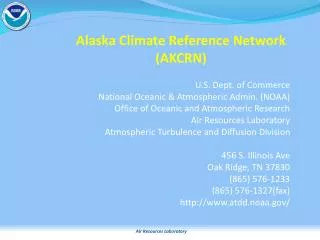
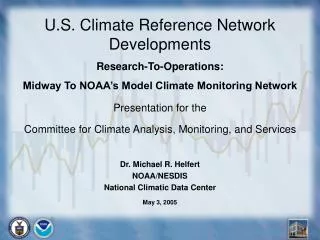
A quick look at the data: US Climate Reference Network Home page http://www.ncdc.noaa.gov/crn/
How reliable do you think US Climate Reference Network records are for characterizing climate? 1-Not reliable 2-Somewhat reliable 3-Very reliable 4-Extremely reliable
NOAA also supports networks of instruments on buoys. These gather data from the depths of the ocean and at its surface
Human efforts facilitate and complement automated data collection
We launch weather balloons to learn about conditions in the lower atmosphere
Balloons and rockets carry data-gathering instruments into the upperatmosphere
and instruments on satellites monitor Earth’s status from orbit
From the bottom of the ocean to the top of the atmosphere, we monitor Earth’s climate system
Presentation prepared by LuAnn Dahlman, NOAA Climate Program Office luann.dahlman@noaa.gov Educators are welcome to share this electronic file.