Download
1 / 8
80 likes | 144 Views
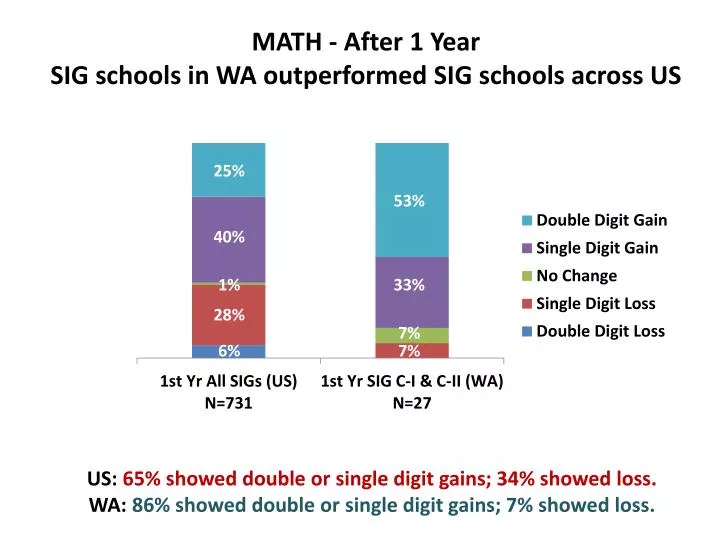
25%. MATH - After 1 Year SIG schools in WA outperformed SIG schools across US. 53%. 40%. 1%. 33%. 28%. 7%. 6%. 7%. US: 65% showed double or single digit gains; 34% showed loss. WA: 86% showed double or single digit gains; 7% showed loss.

E N D
25% MATH - After 1 YearSIG schools in WA outperformed SIG schools across US 53% 40% 1% 33% 28% 7% 6% 7% US: 65% showed double or single digit gains; 34% showed loss. WA: 86% showed double or single digit gains; 7% showed loss.
READING - After 1 YearSIG schools in WA outperformed SIG schools across US 15% 15% 26% 26% 49% 44% 29% 15% 15% 8% US: 64% showed double or single digit gains; 37% showed loss. WA: 70% showed double or single digit gains; 15% showed loss.
SUSTAINING GAINS - After 2 Years SIG Cohort I (N = 17 Schools) 15% 29% 26% 76% 41% • Notes on data for this slide: • WA: Data based on 2010-11 and 2011-12 State Assessments. • US: No 2-year data were available. 12% 12% 18% 12% Math: 88% showed double or single digit gains; 12% showed loss. Reading: 70% showed double or single digit gains; 18% showed loss.
20% 20% 29% 29% 33% 33% ELEMENTARY LEVEL - After 1 Year US showed both double and singledigit losses in M and R. WA showed single digit loss in R. 67% 67% 29% 29% 50% 50% 41% 41% 44% 67% 22% 24% 24% 25% 25% 11% 33% 11% 11% 6% 6% 5% 5% Math: US – 70% showed gains; 30% showed loss. WA - 89% showed gains; none showed loss. Reading: US - 70% showed gains; 30% showed loss. WA - 77% showed gains; 11% showed loss.
MIDDLE SCHOOL LEVEL - After 1 YearUS showed bothdouble and singledigit losses in M and R. WA showed single digit losses in M and R. 47% 6% 6% 19% 20% 19% 21% 29% 21% 25% 43% 43% 19% 67% 53% 54% 29% 29% 44% 50% 47% 43% 41% 36% 75% 50% 30% 6% 21% 28% 30% 7% 21% 28% 24% 25% 33% 14% 14% 6% 10% 10% 14% 6% 6% 7% 5% Math: US - 66% showed gains; 34% showed loss. WA - 79% showed gains; 14% showed loss. Reading: US - 60% showed gains; 40% showed loss. WA - 65% showed gains; 14% showed loss.
HIGH SCHOOL LEVEL - After 1 Year US showed losses in M and R. WA showed losses in M and R. 47% 6% 6% 19% 20% 15% 19% 21% 29% 27% 21% 29% 25% 43% 43% 19% 57% 67% 53% 54% 29% 47% 29% 29% 38% 44% 50% 47% 43% 41% 36% 1% 14% 75% 50% 29% 30% 6% 29% 21% 28% 27% 30% 14% 7% 21% 28% 24% 25% 33% 14% 14% 14% 14% 6% 7% 10% 8% 10% 14% 6% 6% 7% 5% Math: US - 65% showed gains; 34% showed loss. WA - 86% showed gains; 14% showed loss. Reading: US - 62% showed gains; 37% showed loss. WA - 58% showed gains; 28% showed loss.
23% 26% 29% 38% 25% PROGRESS BY LOCALE - MATH After 1 Year SIG schools in WA outperformed SIG schools across US 57% 50% 53% 100% 100% 42% 40% 42% 35% 32% 1% 33% • Notes: • URBAN: Over 50% of US SIGs are urban; only 25% of WA SIGs are urban. • RURAL: Over 50% of WA SIGs are rural; only 19% of US SIGs are rural. 21% 1% 28% 1% 28% 7% 6% 19% 7% 23% 14% 30% 27% 14% 14% 11% 12% 5% 3% US: At least 30% showed loss in each locale. WA: 14% showed loss in one locale (Rural).
PROGRESS BY LOCALE – READING After 1 Year SIG schools in WA outperformed SIG schools across US 15% 14% 14% 15% 15% 28% 33% 33% 25% 53% 39% 47% 40% 50% 71% 56% 43% 33% 67% 1% 33% • Notes: • URBAN: Over 50% of US SIGs are urban; only 25% of WA SIGs are urban. • RURAL: Over 50% of WA SIGs are rural; only 19% of US SIGs are rural. 28% 28% 7% 28% 28% 14% 26% 6% 7% 33% 14% 11% 14% 14% 7% 4% US: At least 30% showed loss in each locale. WA: Less than 15% showed loss in Urban, Suburban, & Rural; 33% showed loss in Town.