Download
1 / 30
300 likes | 420 Views
FEWS NET Climate Change Data Sets and Analyses: Using observations to guide adaptation. Gideon Galu Akhlalil Adoum Nancy Mutunga Everlyn Muchomba Abdulrahim Norein Emebet Kebebe Nigist Biru. Chris Funk Gary Eilerts Jim Rowland Jim Verdin Joel Michaelsen Libby White. Overview.

E N D
FEWS NET Climate Change Data Sets and Analyses: Using observations to guide adaptation Gideon Galu Akhlalil Adoum Nancy Mutunga Everlyn Muchomba Abdulrahim Norein Emebet Kebebe Nigist Biru Chris Funk Gary Eilerts Jim Rowland Jim Verdin Joel Michaelsen Libby White
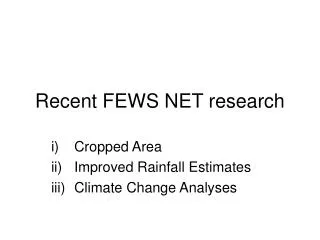
Overview Upscaling What observed large scale climate changes do we see? Downscaling What observed local climate changes do we see? Climate Trend Analyses Kenya, Ethiopia, Uganda, Sudan, Chad, Niger, Mali, Burkina Faso, Senegal Future analyses: guiding agricultural adaptation & development? Up Down
Research Timeline Climate Attribution (why?) Declining ‘Long Cycle’ rainsw/ Phil Steffen & Alemu Asfaw 2002 Warming Indian Ocean Reduces rainfall in GHA 2005 Warming Indian Ocean Probably anthropogenic Declining Rains in Ethiopia and GHA 2008 Climate change intensifies La Nina impacts Declining Rains In Kenya Climate Trend Analyses (what? where?) 2011 Trend mapping Upscale 1
Declining Per Capita Cereal Production • http://www.springerlink.com/content/fw645377u3587404/fulltext.pdf Upscale 2
Principal Components 1 and 2 ENSO-like Variation Warming in the western Pacific and Indian Ocean http://www.springerlink.com/content/u0352236x6n868n2/ http://pubs.usgs.gov/of/2010/1199/pdf/ofr2010-1199.pdf Upscale 3
PC1-PC2 disrupt water vapor transports PC1 Indian-WesternPacific PC2 Central-EasternPacific Upscale 4
←warming→ La Niña Precipitation in new La Niña years. Upscale 5
PC1 and PC2 time-series (smoothed) Drought frequency for Central-Eastern Kenya and Southern Somalia Upscale 6
Drought AND declining per capita agricultural production have contributed to the current food crisis Drought once every six years Drought every other year Climate Index = PC1-PC2 Upscale 7 Rainfall and Ag data are for Kenya and Somalia
Dataset – Foundation - Observations The core FEWS NET data set is a collection of 1344 precipitation stations for the GHA and Sahel A secondary set of air temperature observations is much less dense (179) stations Downscale 1
Dataset – The FEWS NET Climatological Trend Analysis (FTA) Interpolat at-station change values Builds on FCLIM techniques Allows for explicit calculation of interpolation standard errors Incorporates satellite data as ‘background fields’ guiding interpolations Well-documented :ftp://chg.geog.ucsb.edu/pub/pubs/mapping_decadal_variations.pdf The book is currently being printed Precipitation well specified Temperature is not Data set is available at: ftp://hollywood.geog.ucsb.edu/pub/FEWSNETInformingClimateChangeAdaptationSeries/FCLIM_trends/ Downscale 2
1960-2009 Station Trends M A M J J J A S Downscale 3 – FTA
Basically all stations indicate rapid warming(~0.15 to 0.4°C per decade) Downscale 4 - FTA
Observed Trends MAMJ P = Warming in IPA produces subsidence, reduced onshore moisture transports JJAS P = Warming in IPA produces ridging across tropical Africa, reducing Congo airflows? ATL also important … MAMJ, JJAS T = note similarity Cause (?) related to subsidence warming and … Downscale 5 - FTA
Standard Error analysis of trend surfaces Sigma = Trend divided by standard error ≈ signal to noise ratio Downscale 6 - FTA
FCLIM TS – JJAS rainfall for Ethiopia, Sudan and Northern Uganda Downscale 7 – FCLIM TS
Air temperatures have risen sharplymore than 1 standard deviation Downscale 6 – FCLIM TS
2010/2011 Climate Adaptation Reports • Kenya Completehttp://pubs.usgs.gov/fs/2010/3074/pdf/fs2010-3074.pdf • Sudan Complete http://pubs.usgs.gov/fs/2011/3072/pdf/FS2011-3072.pdf • Ethiopia Almost Complete • Uganda Almost Complete • Chad Almost Complete • Niger Almost Complete • Burkina Faso Almost Complete • Mali Almost Complete • Senegal Almost Complete • Mozambique – temperature affects on maize phenology Complete • Openfile report on Indian-Pacific trends Completehttp://pubs.usgs.gov/of/2010/1199/pdf/ofr2010-1199.pdf Climate Trend Reports 1 Email chris@geog.ucsb.edu if interested In seeing/commenting on almost complete reports
Climate Trend Reports 2 The Big Picture: Shrinking Rains Emerging Risk Area?
Ethiopia - Shrinking Rains across the south emergingrisk areas? densepop Climate Trend Reports 3
Ethiopia Rainfall Transects Climate Trend Reports 4
Sudan - Shrinking rains and warming air temperatures Climate Trend Reports 5
Can we afford to NOT to support agricultural development? To date, in FY11 the USG humanitarian aid to the Horn was $604 million In 2009/2010 a 5 million dollar Worldbank project in Kenya led to increased production of ~41,000 tons Seed and fertilizer vouchers for 50,000 people $122 per ton of maize Increasing 2011 production by 20% (472,800 tons) might cost around ~$58 million dollars Theoretical percent hungry would drop by ~45% In FY2011 the US+WFP contributed ~141 million dollars in aid to Kenya, supplying 118,820 tons in aid. Cost = $1,187 per ton Guiding Agricultural Development-1
What can the early warning community contribute to the ag/pastoral development and climate adaptation communities? • Targeting: • Where 1: Invest most in the most food insecure countries • Where 2: Smallholder farms in high potential areas • Where 3: Smallholder farms in high risk areas • How: Must take into account climate variability/trends Guiding Agricultural Development-2 Food Economy Early Warning Remote Sensing Ag/pastoral Development
New dimensions guiding ag development for vulnerability reduction? Ag Exposure (rainfall uncertainty) Ag Opportunity (kg per €) Guiding Agricultural Development-3 vulnerable smallholders vulnerable smallholders poverty reduction lower prices poverty reduction less food aid
Guiding agricultural development for Ethiopia? Forest transition to crop Forest transition to crop+natural veg Analysis Of MODIS landcover data shows most ag expansion In south-central Ethiopia Guiding Agricultural Development-4 Is western Ethiopiaclimatically secure andagriculturally under- utilized? Demographic inertia leads to expansion in stressed & drying southern Ethiopia?
Guiding agricultural development for Kenya? Mean crop per drop map for Kenya (mean yield per MAMJ rainfall ) Is south-western Kenyaclimatically secure andagriculturally under- utilized? Guiding Agricultural Development-5 Demographic inertia leads to expansion in stressed & drying Central-eastern Kenya?
Can we meet the MDG of halving the hungry ? ~$58 million dollars? Decreasing yields by 20% increases The number of hungry by 38% 44% Guiding Agricultural Development-6 2009: 32% 22% Increasing yields By 20% reduces The number of hungry by 45%
Collaborative African Data Archive? • Collaborative archive not tied to a single institution • Satellite based data • 0.05°, dekadal, continental, 1983-now • Rainfall – TARCAT + FCLIM • Vegetation – SPOT + AVHRR • Land Surface Temperatures (TIR) • PET • Station integration • Tools for national/regional agencies to integrate data • Agencies to develop their own trend assessments • Linked to early warning tools • SPIRITS, SERVIR, GeoWRSI, MARS Viewer, Agromet Shell Guiding Agricultural Development-7
Links to research • Recent Drought Tendencies in Ethiopia and equatorial-subtropical eastern Africa, FEWS NET Special Report 2005http://earlywarning.usgs.gov/adds/pubs/RecentDroughtTendenciesInEthiopia.pdf • Warming of the Indian Ocean threatens eastern and southern African food security but could be mitigated by agricultural development. Proceedings of the National Academy (2008) http://earlywarning.usgs.gov/adds/pubs/WarmingInTheIndianOceanThreatensEasternAndSouthernAfrica.pdf • Declining Global Per Capita Agricultural Capacity Production and Warming Oceans Threaten Food Security, Food Security (2009) http://www.springerlink.com/content/fw645377u3587404/fulltext.pdf • New satellite observations and rainfall forecasts help provide earlier warning of drought in Africa. The Earth Observer.http://earlywarning.usgs.gov/adds/pubs/Funk_EarthObserver_Jan_Feb09.pdf • Real-time Decision Support Systems: The Famine Early Warning System Network (2009) ftp://chg.geog.ucsb.edu/pub/pubs/RealtimeDSS_for_FEWS_NET_final.pdf • A westward extension of the warm pool leads to a westward extension of the Walker circulation, drying eastern Africa, Climate Dynamics, 2011. http://www.springerlink.com/content/u0352236x6n868n2/. IP-024695. • Mapping recent decadal climate variations in Eastern Africa and the Sahel, 2011 ftp://chg.geog.ucsb.edu/pub/pubs/mapping_decadal_variations.pdf • A Climate Trend Analysis of Kenya-August 2010, USGS Fact Sheet 2010-3074: http://pubs.usgs.gov/fs/2010/3074/pdf/fs2010-3074.pdf • A Climate Trend Analysis of Sudan-July 2011, USGS Fact Sheet 2011-3072. http://pubs.usgs.gov/fs/2011/3072/pdf/FS2011-3072.pdf