Download
1 / 1
10 likes | 45 Views
Autocrine signaling ligand-receptor pairs (D Mock, Y. Zhou)

E N D
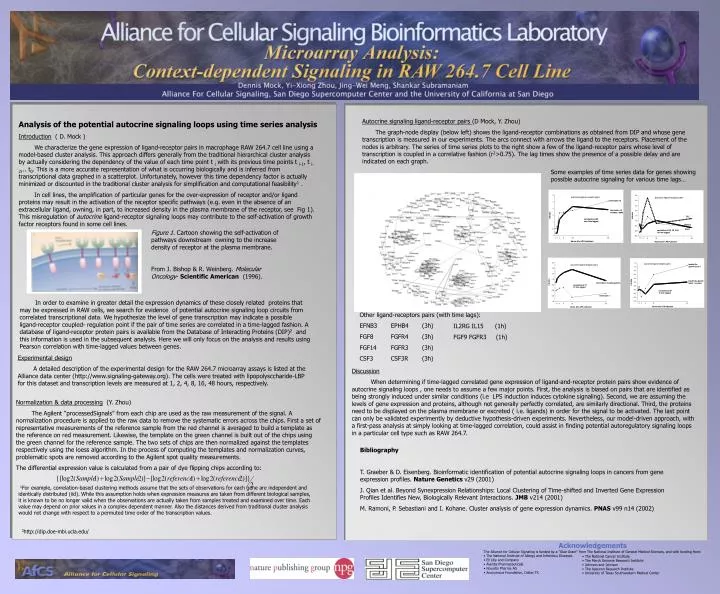
Autocrine signaling ligand-receptor pairs (D Mock, Y. Zhou) The graph-node display (below left) shows the ligand-receptor combinations as obtained from DIP and whose gene transcription is measured in our experiments. The arcs connect with arrows the ligand to the receptors. Placement of the nodes is arbitrary. The series of time series plots to the right show a few of the ligand-receptor pairs whose level of transcription is coupled in a correlative fashion (r2>0.75). The lag times show the presence of a possible delay and are indicated on each graph. Analysis of the potential autocrine signaling loops using time series analysis Introduction ( D. Mock ) We characterize the gene expression of ligand-receptor pairs in macrophage RAW 264.7 cell line using a model-based cluster analysis. This approach differs generally from the traditional hierarchical cluster analysis by actually considering the dependency of the value of each time point t i with its previous time points t i-1, t i-2,.. t0. This is a more accurate representation of what is occurring biologically and is inferred from transcriptional data graphed in a scatterplot. Unfortunately, however this time dependency factor is actually minimized or discounted in the traditional cluster analysis for simplification and computational feasibility1 . In cell lines, the amplification of particular genes for the over-expression of receptor and/or ligand proteins may result in the activation of the receptor specific pathways (e.g. even in the absence of an extracellular ligand, owning, in part, to increased density in the plasma membrane of the receptor, see Fig 1). This misregulation of autocrine ligand-receptor signaling loops may contribute to the self-activation of growth factor receptors found in some cell lines. Some examples of time series data for genes showing possible autocrine signaling for various time lags… Figure 1. Cartoon showing the self-activation of pathways downstream owning to the increase density of receptor at the plasma membrane. From J. Bishop & R. Weinberg. Molecular Oncology- Scientific American (1996). In order to examine in greater detail the expression dynamics of these closely related proteins that may be expressed in RAW cells, we search for evidence of potential autocrine signaling loop circuits from correlated transcriptional data. We hypothesize the level of gene transcription may indicate a possible ligand-receptor coupled- regulation point if the pair of time series are correlated in a time-lagged fashion. A database of ligand-receptor protein pairs is available from the Database of Interacting Proteins (DIP)2 and this information is used in the subsequent analysis. Here we will only focus on the analysis and results using Pearson correlation with time-lagged values between genes. Other ligand-receptors pairs (with time lags): EFNB3 EPHB4 (3h) FGF8 FGFR4 (3h) FGF14 FGFR3 (3h) CSF3 CSF3R (3h) IL2RG IL15 (1h) FGF9 FGFR3 (1h) Experimental design A detailed description of the experimental design for the RAW 264.7 microarray assays is listed at the Alliance data center (http://www.signaling-gateway.org). The cells were treated with lipopolysccharide-LBP for this dataset and transcription levels are measured at 1, 2, 4, 8, 16, 48 hours, respectively. Discussion When determining if time-lagged correlated gene expression of ligand-and-receptor protein pairs show evidence of autocrine signaling loops , one needs to assume a few major points. First, the analysis is biased on pairs that are identified as being strongly induced under similar conditions (i.e LPS induction induces cytokine signaling). Second, we are assuming the levels of gene expression and proteins, although not generally perfectly correlated, are similarly directional. Third, the proteins need to be displayed on the plasma membrane or excreted ( i.e. ligands) in order for the signal to be activated. The last point can only be validated experimently by deductive hypothesis-driven experiments. Nevertheless, our model-driven approach, with a first-pass analysis at simply looking at time-lagged correlation, could assist in finding potential autoregulatory signaling loops in a particular cell type such as RAW 264.7. Normalization & data processing (Y. Zhou) The Agilent “processedSignals” from each chip are used as the raw measurement of the signal. A normalization procedure is applied to the raw data to remove the systematic errors across the chips. First a set of representative measurements of the reference sample from the red channel is averaged to build a template as the reference on red measurement. Likewise, the template on the green channel is built out of the chips using the green channel for the reference sample. The two sets of chips are then normalized against the templates respectively using the loess algorithm. In the process of computing the templates and normalization curves, problematic spots are removed according to the Agilent spot quality measurements. The differential expression value is calculated from a pair of dye flipping chips according to: Bibliography T. Graeber & D. Eisenberg. Bioinformatic identification of potential autocrine signaling loops in cancers from gene expression profiles. Nature Genetics v29 (2001) J. Qian et al. Beyond Synexpression Relationships: Local Clustering of Time-shifted and Inverted Gene Expression Profiles Identifies New, Biologically Relevant Interactions. JMB v214 (2001) M. Ramoni, P. Sebastiani and I. Kohane. Cluster analysis of gene expression dynamics. PNAS v99 n14 (2002) 1For example, correlation-based clustering methods assume that the sets of observations for each gene are independent and identically distributed (iid). While this assumption holds when expression measures are taken from different biological samples, it is known to be no longer valid when the observations are actually taken from samples treated and examined over time. Each value may depend on prior values in a complex dependent manner. Also the distances derived from traditional cluster analysis would not change with respect to a permuted time order of the transcription values. 2http://dip.doe-mbi.ucla.edu/ • Acknowledgements • The Alliance for Cellular Signaling is funded by a "Glue Grant" from The National Institute of General Medical Sciences, and with funding from: • The National Institute of Allergy and Infectious Diseases • Eli Lilly and Company • Aventis Pharmaceuticals • Novartis Pharma AG • Anonymous Foundation, Dallas TX • The National Cancer Institute • The Merck Genome Research Institute • Johnson and Johnson • The Agouron Research Institute • University of Texas Southwestern Medical Center