Download
1 / 22
220 likes | 346 Views
RADIANT SURFACE TEMPERATURE OF A DECIDUOUS FOREST – THE EFFECTIVENESS OF SATELLITE MEASUREMENT AND TOWER-BASED VALIDATION. RESEARCH OBJECTIVES

E N D
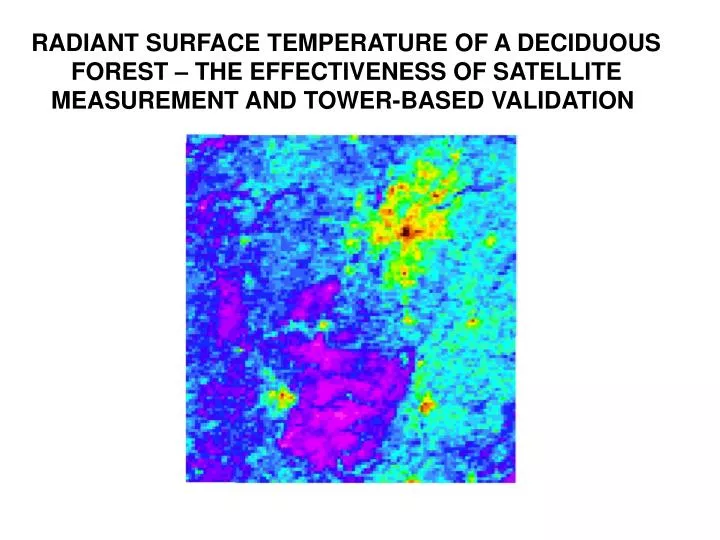
RADIANT SURFACE TEMPERATURE OF A DECIDUOUS FOREST – THE EFFECTIVENESS OF SATELLITE MEASUREMENT AND TOWER-BASED VALIDATION
RESEARCH OBJECTIVES • Assess (allegedly improved) accuracy of radiant land surface temperature (LST) derivation via split-window (SW) algorithm • Identify appropriate validation instrumentation for deciduous forest • Compare long-term continuous LST and air temperature patterns from tower data
METHODOLOGY • Derive AVHRR LST using Qin algorithm using radiosonde profile input - AVHRR imagery concurrent with 2000-1 radiosonde (Zutter 2002) - derive LST for tower pixel and 3X3 window - emissivity from NDVI method and reference values • Compare AVHRR LST to tower radiometer (CG3) LST and air temperature - 71 images over 19 dates - comparison to 46 m tower radiometer, 22 m and 2 m air temp. - identical emissivity values used for 46 m CG3 data • Compare tower radiometer LST to air temperature over various temporal scales - primary comparison of 2001 data (limited 2000 comparisons) - arbitrary selection of 0.98 emissivity for all CG3 data - CG3 46 m and 22 m air temp; CG3 2m and 2 m air temp.
IMAGE PROCESSING/DATA EXTRACTION • Visual cloud clearing • Scan angle extracted from pixel number • Panoramic distortion correction • Radiometric correction - DNs converted to radiance - non-linearity correction • Rectification - performed on small subset images - grid points referenced to Lake Lemon • Selection of 3X3 pixel window centered on tower • Radiance values of 9 pixels exported to ASCII files for processing
ALGORITHM INPUTS • Scan angle • Columnar Water vapor, g/cm2 • Emissivity • Scan angle – from individual images • Water vapor - calculated with LOWTRAN7 - corrected temperature/humidity data from Zutter (2002) radiosondes - default profiles above top of Zutter profiles - rural aerosol extinction profile (23 km visibility) - nighttime images matched to earliest AM radiosonde
ALGORITHM INPUTS cont’d (3) Emissivity - derived in part as function of NDVI (Sobrino et al. 2001) - transition spring/fall images eliminated - leaf-out images implicate max emissivity = 0.989 - winter images – used modeled reference values (Snyder et al. 2001) of 0.968 for Ch. 4, 0.971 for Ch. 5; equivalent to ~ NDVI of 0.3
TOWER DATA PROCESSING • Aberrant data hand corrected from visual inspection • No replacement/interpolation of missing data • Calculated daily averages (1) concurrent data only and (2) independent • Comparisons made of 15-minute data, daily and monthly averages 2001 15-minute Air Temperature Data Uncorrected Corrected
AVHRR TEMPERATURE COMPARISONS AVHRR-CG3 46 m temp. difference 2000-1 AVHRR/CG3 46 m 2000-1
CG3 46 m-Air Temp. 22 m Daily Mean Difference 2001 CG3 46 m-Air temp. 22 m 15-min. data Temp. difference 2001 CG3 LST/AIR TEMPERATURE COMPARISONS
SUMMARY OF TEMPERATURE COMPARISONS MEAN TEMPERATURE DIFFERENCES, ROW MINUS COL. * 15-minute data
STEP CHANGE IN CG3 DATA – DECEMBER 2000 Evident in both CG3s at 46 m CG3 – Tair 22m 2000 2001 CG3 #1 – CG3 #2 Difference
SYNTHESIS OF TEMPERATURE COMPARISONS • CG3 46 m & Tair 22 m are similar to within <0.5 K (from 2000 data) • AVHRR is substantially (~ 2 K) less than both CG3 46 m and Tair 22 m • Large positive bias exists in the 2001 CG3 data (both 46 m and 2 m) • CG3 46 m and Tair 22 m may be comparable long term climate variables • Absent negative AVHRR bias, either CG3 46 m or Tair 22 m may be suitable for comparison to satellite data • Search for sources of AVHRR (low) and CG3 (high) bias
SOURCES OF AVHRR BIAS Treatment of and apparent insensitivity of Qin algorithm to water vapor (Fig. 9) – results in relatively low LST
SOURCES OF AVHRR BIAS (cont’d) High transmittance from Qin algorithm equations (Table 9) – results in relatively low LST
SOURCES OF AVHRR BIAS (cont’d) EMISSIVITY Simultaneous Channel 4/5 error: .005 error 0.3-0.4 LST error Single channel error: .005 error 0.7-0.9 LST error Range of possible values 0.989/0.989 Ch. 4/5 – Qin/Sobrino (NDVI) 0.9735/0.9732 Ch. 4/5 – NASA JPL Spectral Library
AVHRR BIAS cont’d RESOLUTION – 2 K variability w/in 1 km pixel ASTER Brightness Temperature, 90 m resolution (June 16, 2001)
CONCLUSIONS – QIN/SPLIT WINDOW ALGORITHM • Uncertainties in water vapor and transmittance treatments • Small uncertainty in profiles used to derive transmittance equations • Substantial emissivity uncertainty • SW algorithm is generally not very portable • More generic atmospheric correction methods are preferable • Refinement of emissivity values is required
SOURCES OF CG3 BIAS 2 m difference, CG3 minus Tair – no abrupt jump from 2000 to 2001 different mechanisms/conditions between 46 m and 2 m 2000 2001
KZT-Tair difference CG3-Tair difference CG3 BIAS at 2 m – Solar heating Instrument body temperature (KZT) vs. Tair identifies solar heating effects • If CG3 is in equilibrium, elevated KZT should not cause positive CG3 bias • Since increased CG3-Tair difference occurs at times of apparent solar heating, some of the bias may be due to solar heating of CG3 window
CG3 BIAS at 46 m CG3-Tair (22 m) difference KZT-Tair (46 m ) difference • High CG3 bias even when KZT is lower than 46 m air temperature (general air temperature profile increases above canopy) • Indicates a greater CG3 bias than at 2 m, but not clearly related to instrument body temperature
CONCLUSIONS – CG3 BIAS • Some of the bias results from internal (solar) heating effects • Given jump in December 2000 and high bias even at night, suspect instrument setup/calibration problem at 46 m • Possible problems with 2 m and 46 m air temperature hinder drawing definitive conclusions
OVERALL CONCLUSIONS • AVHRR Results are in line with previous studies • Little advantage to use of existing split window algorithms • Acceptable accuracy in deciduous forest is achievable with proper emissivity/atmospheric correction • Tower radiometer appears appropriate type of instrument for satellite validation • Upper canopy air temperature may be similar to satellite or tower LST • Forest LST and air temperature exhibit similar long term patterns and differences may converge over long time periods