Download
1 / 37
440 likes | 761 Views
Elasticities and Regression Analysis. Chapter 3. Suppose the price of a good increased by 50%. How would that change the amount you buy?. Diet Coke. Aspirin. Gasoline. Espresso Royale Coffee. MSU Basketball tickets. Shoes. Inelastic. Elastic. Own Price Elasticity of Demand Defined.

E N D
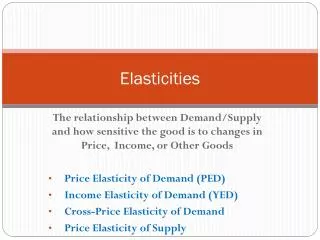
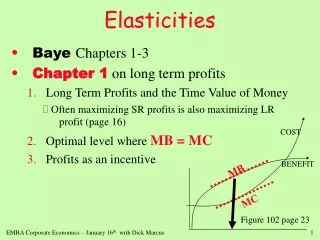
Elasticities and Regression Analysis Chapter 3
Suppose the price of a good increased by 50%. How would that change the amount you buy? Diet Coke Aspirin Gasoline Espresso Royale Coffee MSU Basketball tickets Shoes Inelastic Elastic
Own Price Elasticity of Demand Defined • How sensitive quantity demanded is to price • More formally: Where D means “change”
Example • What is the own price elasticity of demand for cigarettes? • -0.4 • Interpret this number: • A 1% increase in the price of cigarettes will lower the quantity demanded by 0.4 %
Example • If the government wanted to decrease smoking by 10 percent, by how much would the government have to increase the price of tobacco? = .25 = 25%
What determines relative price elasticity? • Number of substitutes • The more substitutes or the closer the substitutes, the… • more elastic • Time interval • The longer time interval the… • more elastic • Share of budget • The larger share of the budget the … • more elastic Ex. Diet Coke Ex. Gasoline Ex. Salt
Own Price Elasticity of Demand • Why do we care? • Tells us what affect a D in P will have on revenue • Tells us what affect a D in P will have on Q (ex: taxes)
Own Price Elasticity of Demand • What sign does it have? • Negative, Why? • Law of Demand
Calculating Own Price Elasticity of DemandAt a single point, small changes in P and Q
Own Price Elasticity and demand along a linear demand curve • The equation for the demand curve below is P = 12-2Q • The slope of the demand curve is -2
Calculating Own Price Elasticity of Demand @ B -∞ -5 -2 -1 -1/2 -1/5 0 =-5
Own Price Elasticity of Demand • hd <-1 (further from 0) is Elastic % change in QD> % change in P • hd>-1 (closer to 0) is Inelastic • % change in QD< % change in P
Calculating Own Price Elasticity of Demand hd<-1: Elastic - hd>-1: Inelastic
Extremes • Perfectly Inelastic • completely unresponsive to changes in price D P Ex. Insulin 5 4 Q 5
Extremes • Perfectly Elastic • completely responsive to changes in price P Ex. Farmer Joe’s Corn 5 D 4 Q 5
Elasticity and Total Revenue • Total revenue is • the amount received by sellers of a good. • Computed as: TR = P X Q
Intuition Check • If an item goes on sale (lower price), what will happen to the total revenue on that item?
Elasticity and Total Revenue • Marginal Revenue is • the additional revenue from selling one more of a good. • Computed as: MR = DTR/DQ
Own Price Elasticity of Demand MR 0 10 10 6 16 2 18 -2 16 TR -6 10 -10 0
Income Elasticity of Demand Defined • How sensitive quantity demanded is to income • More formally: Where M means “income”
Interpreting Income Elasticity • Suppose Income elasticity is 2 • A 1 percent increase in income leads to a... • 2 percent increase in quantity demanded
Sign of Income Elasticity Ex. Great Harvest Bread • Positive • Normal Good • Negative • Inferior Good Ex. Spam
Cross-price Elasticity of Demand Defined • How sensitive quantity demanded of X is to a change in the price of Y • More formally: Where PY means “price of Y”
Sign of Cross Price Elasticity • Positive • substitutes • Negative • complements Ex. Accord and Taurus , Diet Coke and Diet Pepsi Ex. Pizza and Beer, gasoline and SUVs, software and hardware
Estimating Elasticities from Data Demand for Good X QDx = f(Px, PY, M, H1 , H2, …) where, Px is the price of good X, PY is the price of good Y, M is income, H1 is size of population, H2 is consumers’ expectations.
Estimating Elasticities from Data • Assume linear demand, QDx = α0+ αxPx + αYPY + αMM + αH1 H1 … • Or assume log linear demand, log(QDx)= β0+ β xlog(Px)+ β Ylog(PY)+ β Mlog(M) + β H1log(H1)…
Estimating Own Price Elasticity When the change is “very, very” small,
Estimating Own Price Elasticity If assume, QDx = α0+ αxPx + αYPY + αMM + αH1 H1 … Then, αx so, = αx
Estimating Own Price Elasticity If assume, log(QDx)= β 0+ β xlog(Px)+ β Ylog(PY)+… Then, β x so, = β x
Estimating Cross Price Elasticity [Similar to estimating own price elasticity except consider the affect of a change in the price of Y on the quantity demand of X.] • If assume linear specification, • If assume log linear specification,
If you are a manager, why would you pay an economist big $$$ to estimate these elasticities? • Quantify how a change in (own) price affects quantity demanded. • Forecast future demand. • If you offer a product line, you want to know how a change in price in one good affects the quantity demanded of another good you produce.
Elasticities and Public Policy • If you are a public official, why might you care about elasticities for alcohol, drugs and cigarettes? • How do you estimate these elasticities?
Words of Caution • There are many complicated issues associated with estimating elasticities. To accurately estimate these elasticities, one needs detailed knowledge of the product/industry, sophisticated statistical techniques, reasonable variation in prices/quantities and precise data.
Estimating Elasticities of Ethanol Gasoline (Soren Anderson, 2010) Uses gas station level data from Minnesota Regression Specification, log(QDe)= β 0+ β elog(Pe)+ βglog(Pg)+βFlog(FFV) + βSlog(Stations)+ε where, Pe is price of ethanol, Pg is price of gasoline, FFV is the number of flex-fuel vehicles in county and Stations is the number of station with ethanol in county.
Estimating Elasticities of Ethanol Gasoline (Soren Anderson, 2007) Regression Results, log(QDe)= β 0-1.65log(Pe)+ 2.62log(Pg) +0.07log(FFV)-0.14log(Stations)