Download
1 / 49
490 likes | 678 Views
CEFOR - The 2006 NoMIS Report. No rdic M arine I nsurance S tatistics Underwriting Years 1995–2006, as of 31 December 2006. 2006 CEFOR Norwegian Marine Insurance Statistics – Part 1 As of 31 December 2006. Part 1 – Introduction Contents NoMIS Explanations

E N D
CEFOR - The 2006 NoMIS Report NordicMarineInsuranceStatisticsUnderwriting Years 1995–2006, as of 31 December 2006
2006 CEFOR Norwegian Marine Insurance Statistics – Part 1As of 31 December 2006 • Part 1 – Introduction • Contents • NoMIS • Explanations • Part 2 – NoMIS position in the Global insurance market • Global Marine Hull Insurance Market 2005 • Norwegian Marine Hull Insurance Market 2006 • Average gross share written in the NoMIS market • Part 3 – NoMIS portfolio Key figures, underwriting years 1995-2006 • Number of vessels • Development of average insured values, DWT and premium • Average age • Average standard deductible • Loss Ratio (including IBNR), 1985-2007 • Premiums and claims (including IBNR) per vessel • Claims in claim bands – claim per vessel • Number and cost of claims by type • Claim frequency • Claim per vessel • Claim per Sum Insured • Key figures (table)
2006 CEFOR Norwegian Marine Insurance Statistics – Part 1As of 31 December 2006 • Part 4 – Key figures by age group • Distribution of number of vessels • Claim frequency • Claim per vessel • Claim per Sum Insured • Claim per DWT • Loss Ratio • Part 5 – Key figures by vessel type group • Distribution of number of vessels • Claims frequency • Claim per vessel • Claim per Sum Insured • Claim per DWT • Loss Ratio • Legal disclaimerCEFOR provides the statistics material in this presentation for general information purposes only. All key figures are derived from the CEFOR portfolio, which reflects a minor part of the world fleet, the selection of ships being biased by Norwegian underwriting preferences. Therefore CEFOR can accept no responsibility and shall not be liable for any loss which may arise from reliance upon the information provided.
2006 CEFOR Norwegian Marine Insurance Statistics – Part 1As of 31 December 2006 • Part 6 – Key figures by size group • Distribution of number of vessels • Claims frequency • Claim per vessel • Claim per Sum Insured • Claim per DWT • Loss Ratio • Part 7 – Distribution by flag and classification society • Distribution of number of vessels by flag, 16 largest • Distribution by black, grey, white flags (Paris MOU classification 2005) • Distribution of number of vessels by classification society, 6 largest • Part 8 – Premium indices • Premium per vessel – Premium per sum insured – Cash Renewal Index • Part 9 – Exposure curves (partial claims only) • Sum Insured bands (<5, <20, <100, and >100 Mio USD) • Explanations
2006 CEFOR Norwegian Marine Insurance Statistics – Part 1As of 31 December 2006 IntroductionThe Nordic Marine Insurance Statistics (NoMIS) is a joint database project of CEFOR members active on the Hull & Machinery market to compile insurance data and vessel characteristics for statistical purposes. The database is administered by CEFOR.Since its foundation in 1985 until 1997 the data was compiled by appointing CEFOR a compulsory facultative reinsurer to which the members of the Norwegian Hull Agreement ceded 0.1% of their Hull & Machinery insurance. Premium and claims information was exchanged via Borderaux, the lead insurer providing details of each claim. When the Hull Agreement was discontinued in December 1996, the statistics cooperation continued. In 1998 steps were taken to update the NoMIS’ database electronically. All necessary routines were in place by December 1999, enabling CEFOR to produce up-to-date hull figures on a monthly basis and extending the database substantially by including non-lead business from underwriting year 1998. In 2000, a further step was taken to restructure the database to extend the updates to include also non-lead business back to underwriting year 1995. In 2003, data from a major new member was integrated, dating back to underwriting year 1995. In 2004, the database was extended by data from two new members and in both 2005 and 2006 data from further members was added. This includes data written from other Nordic countries. The number of registered vessels reached in 2006 an all-time high of 10,804 vessels. Compared to the world fleet, the NoMIS database covers in 2006 about 25% of the world fleet above 300 GT in terms of numbers and 52% in terms of tonnage.By 31st December 2006, in all 108,183 vessel years (vessels with IMO-number) and 33,345 claims were registered for the underwriting years 1985 through 2006. The NoMIS statistics in this report comprise data from: Bluewater Insurance ASA, Codan Group (Codan Marine, Denmark; Codan Marine Services, Norway; Trygg-Hansa Marine, Sweden), Gard, Gjensidige Forsikring, NEMI ASA, Norwegian Hull Club, Swedish Club, Zurich Protektor Forsikring AS.
2006 CEFOR Norwegian Marine Insurance Statistics – Part 1As of 31 December 2006 All amounts are presented in USD. Rate of exchange applicable to convert the figures from the original currencies into USD: Premiums: average monthly rate of exchange of the month of transaction Paid claims: average monthly rate of exchange of the month of transaction Outstanding claims: average monthly rate of exchange of December 2006 All premiums are net of all rebates and commissions. All claims are net of any deductiblesapplicable. Total Claims = Paid claims + Outstanding claims TLO (or Total Losses) = claims in excess of 75% of the Sum Insured Partial Losses = all losses <= 75% of the Sum Insured Loss Ratio = Total claims / Net premium Underwriting year = year in which the insurance attaches
2006 CEFOR Norwegian Marine Insurance Statistics – Part 1As of 31 December 2006 Types of vessels specified Vessel Type group Vessels Types included Lloyds Conf. Index Code BULK Bulk, Ore, Cement BBU, BCB, BCE, BOR, BWC CAR/RORO Car Carrier, RoRo MVE, URC, URR CARGO Dry Cargo, General Cargo, Reefers, GCT, GGC, GPC, GRF, MLV Pallett Vessels, Animal Transport Vessels CHEM./PRODUCT Chemical Carriers, Product / Acid / Edible Oil / TAC, TCH, TCO, TEO, TFJ, TFO Fish Oil / Fruit Juice / Wine / Molasses / TMO, TPD, TWA, TWN, TWT Waste/ Water Tankers CONTAINER Container UCC, UCR LNG/LPG Gas Carriers LNG, LPG, LNG/LPG LNG, LPG, LNP OBO Combined Vessels Bulk, Ore, Oil COO, CBO OTHER all other ships and floating units all other codes not specifically defined otherwise, like Fishing vessels, Barges, Cranes, Floating Storage, Floating Production, Pollution Control Vessels, Mud boat, Research vessels, Cable, Seismic Search vessel, Flo/Flo, etc.
2006 CEFOR Norwegian Marine Insurance Statistics – Part 1As of 31 December 2006 Types of vessels specified contd. Vessel Type group Vessels included Lloyds Conf. Index Code PASSENGER All types of passenger vessels and ferries, LOF, LOP, MPR, OFY, OHF, Passenger/Roro, Highspeed Craft OHS, PRR SUPPL/OFF Supply, Anchorhandling, Standby, Drilling OBS, OBT, ODS, OIB, OIF, OIS, Vessel, General Service Vessel, OIT, OLT, OMN, OMT, OOS, OPP, Supply (Tug, Anchor), Tug/Icebreaker ORP, OSU, OSY, OSZ, OWO, XAA, XAF, XAG, XAH, XAT, XCT, XFF, XFS, XPT, XTG, XTI, XTP, XTR, XTS, XTT, XTX TANK Tanker, Sludge Vessel, Crude Oil Tanker OSC, OTC, TAS, TBK, TCR, Asphalt Carriers, Bunkering Tanker, TNA, TTA Naval Auxiliary
2006 CEFOR Norwegian Marine Insurance Statistics – Part 2 Distribution of Global Marine Hull Premium 2005 (Business written from Norway only) (Business written from Norway only) World Norway
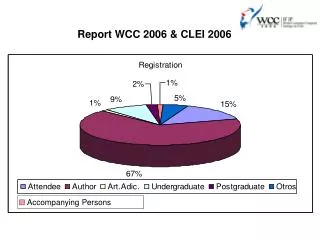
2006 CEFOR Norwegian Marine Insurance Statistics – Part 2 Distribution of CEFOR Marine Hull Premium 2006 Including Coastal Excluding Coastal ! Note:The premium overview on this slide INCLUDES Loss of hire, hull and freight interest and building risk in addition to hull. Whereas all following statistics are pure hull statistics and EXCLUDE Loss of hire, hull and freight interest and building risk !
2006 CEFOR Norwegian Marine Insurance Statistics – Part 2As of 31 December 2006 Average share = Sum of members gross premiums according to their written share / Sum of premiums for 100% of the risk(Sum = sum over all vessels in the NoMIS portfolio)
2006 CEFOR Norwegian Marine Insurance Statistics – Part 3As of 31 December 2006 • Comments: • Decline in portfolio from 1997 to 2000 due to members concentrating on target business • Increase 2000->2006 due to both market growth and new members joining the NoMIS datapool. Database comprises business underwritten from all Nordic countries in addition to Norway.
2006 CEFOR Norwegian Marine Insurance Statistics – Part 3As of 31 December 2006
2006 CEFOR Norwegian Marine Insurance Statistics – Part 3As of 31 December 2006
2006 CEFOR Norwegian Marine Insurance Statistics – Part 3As of 31 December 2006
2006 CEFOR Norwegian Marine Insurance Statistics – Part 3As of 31 December 2006
2006 CEFOR Norwegian Marine Insurance Statistics – Part 3As of 31 December 2006 CBNI = Covered But Not yet Incurred IBNR = Incurred But Not yet ReportedOutstanding = Incurred and reported, but not yet paid
2006 CEFOR Norwegian Marine Insurance Statistics – Part 3As of 31 December 2006 Claim bands:
2006 CEFOR Norwegian Marine Insurance Statistics – Part 3As of 31 December 2006 Claims by Claims type Total 2005: 2,395
2006 CEFOR Norwegian Marine Insurance Statistics – Part 3As of 31 December 2006 Claims by Claims type Total 2005: USDm 707
2006 CEFOR Norwegian Marine Insurance Statistics – Part 3As of 31 December 2006 Comment: Claims < 10.000 USD account for about half of all claims. Registration of thesemay vary over time and in each company and will thus influence the registered frequency.In addition any increase/decrease of insurance deductibles will have impact on the registered frequency
2006 CEFOR Norwegian Marine Insurance Statistics – Part 3As of 31 December 2006
2006 CEFOR Norwegian Marine Insurance Statistics – Part 3As of 31 December 2006
2006 CEFOR Norwegian Marine Insurance Statistics – Part 3As of 31 December 2006 1) The figures in the table are 100% figures, per vessel underwritten by CEFOR companies. They do reflect the CEFOR portfolio as a whole but NOT the shares or results of the CEFOR members. The 2006 underwriting year is still at risk. Approximately 60% of the premium is earned as of 31.12.06. 2) Premium and claim figures per vessel, DWT and sum insured can be used to calculate “expected loss ratios” at the current premium level. As a simple example, an estimate based on claims and premium per sum insured is derived as follows: Average claim per SI / 2006 premium per SI = 0.283/0.280 = 101% 3) Total losses are defined as claims in excess of 75% of the sum insured of the vessel. Only vessels with valid IMO-No. are included.
2006 CEFOR Norwegian Marine Insurance Statistics – Part 4 As of 31 December 2006 Number of vessels per age group Total number of vessels 2001-2005: 41,527 2006: 10,804
2006 CEFOR Norwegian Marine Insurance Statistics – Part 4As of 31 December 2006 Comment: Claims < 10.000 USD account for about half of all claims. Registration of thesemay vary over time and in each company and will thus influence the registered frequency.In addition any increase/decrease of insurance deductibles will have impact on the registered frequency
2006 CEFOR Norwegian Marine Insurance Statistics – Part 4As of 31 December 2006
2006 CEFOR Norwegian Marine Insurance Statistics – Part 4As of 31 December 2006
2006 CEFOR Norwegian Marine Insurance Statistics – Part 4As of 31 December 2006
2006 CEFOR Norwegian Marine Insurance Statistics – Part 4As of 31 December 2006
2006 CEFOR Norwegian Marine Insurance Statistics – Part 5As of 31 December 2006 Number of vessels per vessel type Total number of vessels 2001-2005: 41,527 2006: 10,804
2006 CEFOR Norwegian Marine Insurance Statistics – Part 5As of 31 December 2006 Notes:- ”Tank” includes in this and the following slides: Chemical/Product, LNG/LPG, OBO and other tank vessels - Claims < 10.000 USD account for about half of all claims. Registration of these may vary over time and in each company and will thus influence the registered frequency. In addition any increase/decrease of insurance deductibles has impact on the registered frequency
2006 CEFOR Norwegian Marine Insurance Statistics – Part 5As of 31 December 2006
2006 CEFOR Norwegian Marine Insurance Statistics – Part 5As of 31 December 2006
2006 CEFOR Norwegian Marine Insurance Statistics – Part 5As of 31 December 2006
2006 CEFOR Norwegian Marine Insurance Statistics – Part 5As of 31 December 2006
2006 CEFOR Norwegian Marine Insurance Statistics – Part 6As of 31 December 2006 Number of vessels per Size Group Total number of vessels 2001-2005: 41,527 2006: 10,804
2006 CEFOR Norwegian Marine Insurance Statistics – Part 6As of 31 December 2006 Comment: Claims < 10.000 USD account for about half of all claims. Registration of thesemay vary over time and in each company and will thus influence the registered frequency.In addition any increase/decrease of insurance deductibles will have impact on the registered frequency
2006 CEFOR Norwegian Marine Insurance Statistics – Part 6As of 31 December 2006
2006 CEFOR Norwegian Marine Insurance Statistics – Part 6As of 31 December 2006
2006 CEFOR Norwegian Marine Insurance Statistics – Part 6As of 31 December 2006
2006 CEFOR Norwegian Marine Insurance Statistics – Part 6As of 31 December 2006
2006 CEFOR Norwegian Marine Insurance Statistics – Part 7As of 31 December 2006 Number of vessels per largest flags Total number of vessels 2001-2005: 41,527 2006: 10,804
2006 CEFOR Norwegian Marine Insurance Statistics – Part 7As of 31 December 2006 Vessel distribution by flag Based on Paris MOU classification (effective 1 July 2006, updated 17 October 2006)
2006 CEFOR Norwegian Marine Insurance Statistics – Part 7As of 31 December 2006 Number of vessels per classification society Total number of vessels 2001-2005: 41,527 2006: 10,804
2006 CEFOR Norwegian Marine Insurance Statistics – Part 8As of 31 December 2006
2006 CEFOR Norwegian Marine Insurance Statistics – Part 9As of 31 December 2006 PA claims in % of all claims :0-5 Mio USD: 66% 5-20 Mio USD: 77% 20-75 Mio USD: 78% > 75 Mio USD: 100% Sum Insured
2006 CEFOR Norwegian Marine Insurance Statistics – Part 9As of 31 December 2006 • Exposure Curves • Exposure curves are used by reinsurers to price excess of loss reinsurance. • The curves indicate the ceding company's retained share of PA claims after ceding claims in excess of a given percentage of a vessel’s sum insured. • The curves should be applied on individual vessels or groups of vessels with similar values and written shares. • The curves are calculated for 100% values. In applications the choice of curve should thus also be based on 100% values. • Exposure Curves technicalities • The curves are based on H&M covers only for vessels with valid IMO-No. • The curves are based on the underwriting years 1995-2005 (15,000 claims) • The curves are calculated as follows: x = percentage retained C = Individual partial claims V = Vessel value f(x) = Σ min[C, V*x]/Σ C
2006 CEFOR Norwegian Marine Insurance Statistics – Part 9As of 31 December 2006 • Links to other marine insurance statistics: • CEFOR Annual Report 2006:http://www.cefor.no/ • CEFOR website, Statistics section: (CEFOR and IUMI statistics for download, including historical data) • http://www.cefor.no/statistics/statistics.htm • IUMI (International Union of Marine Insurance): Presentations at the Facts & Figures Committee’s Open Forum and all other conference presentations available for download fromhttp://www.iumi.com/ , check > conferences on menu