Download
1 / 21
260 likes | 484 Views
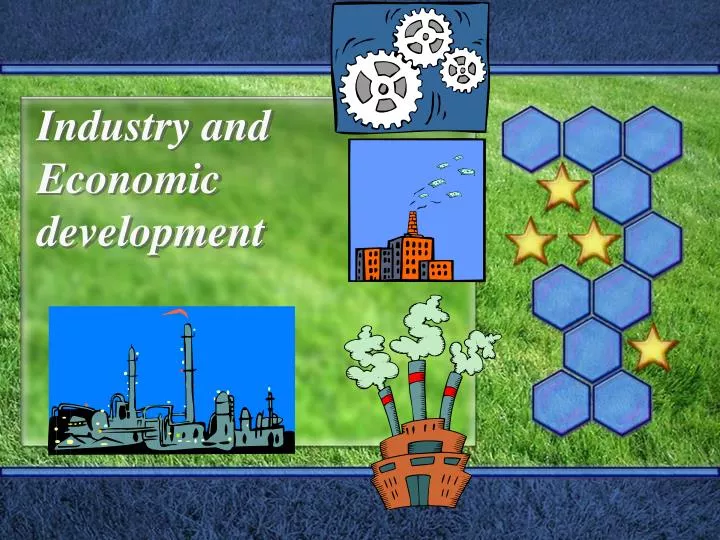
Industry and Economic development. Types of Industry. Primary: Extraction: renewable vs. nonrenewable Secondary: Manufacturing Tertiary:Distribution of goods, services and information Quaternary: Services required by producers Quinary:Research, upper level management, commodifcation.

E N D
Types of Industry • Primary: Extraction: renewable vs. nonrenewable • Secondary: Manufacturing • Tertiary:Distribution of goods, services and information • Quaternary: Services required by producers • Quinary:Research, upper level management, commodifcation
Issues: • Specialization of places • Comparative advantage. • lower production costs, cheaper raw materials, etc. • places with favorable growing conditions and inexpensive labor. • Silicon Valley: • specializes in technology innovation • highly skilled labor, creative entrepreneurs, and ready supply of investment capital • Transportation • Complementarity • intervening opportunity • transferability
Agglomeration vs. Deglomeration • Agglomeration • the concentration of enterprises in a locale • a cluster of activities create enough demand for support services in a particular place (for example, temporary workers, restaurants, legal advisors, or specialist engineers). • activities needing access to information and control tend to concentrate • an infrastructure of cultural institutes such as school, hospitals, and services reach a certain level so new and divergent investment is attracted to the area
Agglomeration vs. Deglomeration • Deglomeration • de-concentration due to technological change or increased costs of continued clustering • occurs when too many activities, perhaps of the wrong type, are too close together. • Traffic congestion, pollution, labor shortages, capital shortages, supply shortages caused by local demand, increased land prices, and a general decay of infrastructure because of the intense use of the infrastructure • cause some enterprises to move out of the traditional centers
Example: New York • New York= U.S. economic core • Manhattan/ Wall street address gave status to businesses • Being in the “center of things” helped businesses grow • Infrastructure and supporting businesses already in place • However- • Sky-high rent, major traffic issues, and other problems of downtown life • Businesses move out of NYC for space, lower rent, higher standard of living for employees, etc.
Core vs. Periphery • Core = regions with concentrations of employment, capital, and economic control. (within a country or globally) • On a regional scale, develop through agglomeration • backward linkages- with firms that provide supplies for the company • forward linkages- with retailers, ad agencies, transporters, etc. • and support industries (housing, food, schools, etc.) • profits = re-invested into infrastructure developments or to develop new forms of technology which could launch new industrial expansion.
Global Economic Models • Structuralists • believe that the growth of the core is only possible through the systematic underdevelopment of the periphery. • Wallerstein's world systems model • Dependency model • Liberalists • All countries are on the same trajectory, passing through stages as they develop. • All countries are capable of progression along that trajectory • Rostow’s modernization model
Rostow’s model of Economic Development • Traditional • Preconditions of Take off • Take off • Drive to maturity • High mass consumption
Critiquing Rostow’s Model • Developmentalism vs. Sustainable Development • “high mass consumption” for all? • Dependence on MDCs and their markets. • Undue influence on many global policies, including those of the U.N. and World Bank. • Market Stagnation: • the MDCs have limited population growth. • Markets grow slowly • Undervalues the obstacles and competitive disadvantages faced by LDCs and former colonies • Those involved in primary resource production, especially
Location of MDCs and LDCs Development generally reflects a North-South split in the world.
Mapping the Core-periphery model • Choose factors of development • IMR, TFR, literacy, GNP, etc. • Compare regions to determine statistical “breaks.” • Then, determine what is ‘definition’ of development (according to factors) and categorize world regions accordingly • Keeping in mind notable exceptions • Can use 2, 3, or 4 categories • Core- Periphery • Core- Semiperiphery- Periphery • Most Developed- More developed- Less Developed- Least Developed • Color code a map, creating a key, etc. • Justify factors and categories
International Development • United Nations - formed in 1945 to promote peace. 189 current members. • World Bank - financial assistance and loans. Owned by 189 United Nations members. • International Monetary Fund - arm of U.N. that surveys and oversees international money exchange to prevent monetary crises. Also provides loans and training to help countries with balance of payment problems. • Non-Governmental Organizations (NGOs) - World Watch, Human Rights Watch, World Commission on Dams, Grameen Bank, Kiva.org, many others.
Deindustrialization • industrial activity is unevenly located through space • diffusion • fixed costs • Industries seek to maximize profit and minimize cost • higher amenity values, low rates of unionization, government contracts, and availability of sites • Drew investment away from the locations with high fixed costs. • New International Division of Labor
Gravity Model • larger places attract people, ideas, and commodities more than smaller places and places closer together have a greater attraction • relative strength of a bond between two places • multiplying the population of city A by the population of city B and dividing the product by the distance between the two cities squared.
Examples: • New York and L.A.: 52.9 million • El Paso and Tucson: 8 million • El Paso and L.A.: 21 million • Created to anticipate migration streams • Can also be used for traffic/ interaction • Time- Space compression • Use functional distance (flight time?)
Chart to fill out for material world posters. I usually have them analyze 3-5 pictures each. Material World Students also write an essay, answering a number of questions related to material vs. non-material culture and globalization.
Links • http://www.bized.co.uk/educators/16-19/economics/development/lesson/poverty.htm • http://www.pbs.org/wgbh/nova/worldbalance/material.html