Download
1 / 17
170 likes | 304 Views
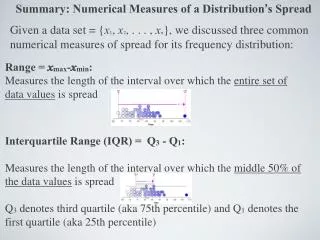
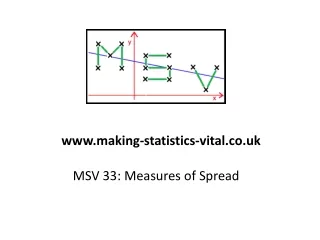
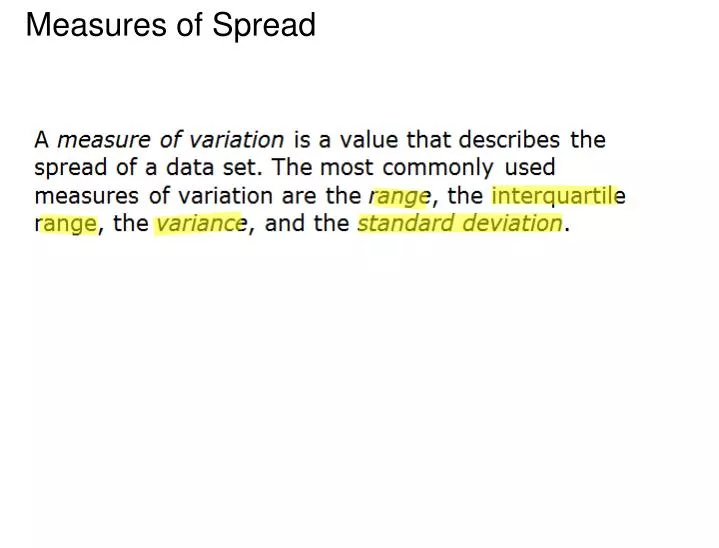
Measures of Spread. Which distribution has the smallest standard deviation?_____ Which distribution has the largest standard deviation?_______. I know that the graph with the smallest standard deviation typically has the smallest ________________. What are these math symbols?. Variance =.

E N D
Which distribution has the smallest standard deviation?_____ Which distribution has the largest standard deviation?_______ I know that the graph with the smallest standard deviation typically has the smallest ________________.
What are these math symbols? Variance = Standard Deviation =
Let's do one by hand! =______________ Variance = =____________ Standard Deviation =
Your Turn to find the Standard Deviation. What's Step 1?____________ Do it. What's Step 2?_______________ Do it. What's step 3?____________ Do it What's step 4?___________ Do it.
Compare your last two standard deviations. Which Standard Deviation is bigger? Circle the graph with the larger standard deviation. A graph with the larger range typically has the larger standard deviation. However, these two graphs have the same standard deviation. How can you tell which standard deviation is larger if the graphs have the same range?______ ___________________ ____________________
Whew! Do you have to do ALL of that every time you need to know the standard deviation?? NOPE!
Use your calculator to find the mean, variance, and standarddeviation (Stat, Edit) mean = ______ variance=_____ standard deviation=_____
What if there are outliers? The mean and standard deviation are not resistant to outliers. Outliers will pull the mean away from the center and make the standard deviation too large. If there are outliers, the median is a better measure of center and the IQR....interquartile range....is a better measure of spread. Which statistics are affected by outliers?_____ ____________ ____________ ____________ Which statistics are not affected by outliers?___ ________________________ Data A: 1, 2, 3, 4, 5 Data set B: 1, 2, 3, 4,500 mean:________ mean:________ stand. dev.______ stand.dev.______ median:_____ median:_____ IQR (Q3-Q1):______ IQR:_____ range:_________ range:_______
For each boxplot, find the range and IQR. Which picture has the smallest IQR? Which has the largest IQR? Repeat for the histograms. Is it easier to see the IQR in boxplots or histograms? Range:_________ IQR:_________ Range:_________ IQR:_________ Range:_________ IQR:_________ Range:_________ IQR:_________ Range:_________ IQR:_________ Range:_________ IQR:_________
Outlier... remember this? Write down the data values in the histogram. _______________________ outliers<Q1-1.5(IQR) outliers>Q3+1.5(IQR) What is the 5 number summary min____ Q1=____ median=____ Q3 =____ max =_____ What is the IQR?______ Calculate Q1-1.5IQR=_____ and Q3 + 1.5IQR=____ Which values are outliers?____
Using the same distribution. Use your calculator to compute the standard deviation with the outlier(s) and without the outlier(s). Standard deviation of all points:______ Standard deviation without outliers:_____ How has the standard deviation changed?_______________________________
Linear Transformations on summary statistics Given the following data set, use your calculator to find the following summary statistics: Multiply all of the data values by 2. Find the new summary statistics. How do the summary statistics change? Compare the two data sets. Which summary statistics changed?___________________ By how much?______________
Given the following data set, use your calculator to find the following summary statistics: Add 5 to all of the data values. Find the new summary statistics. How do the summary statistics change? Compare the two data sets. Which summary statistics changed?___________________ By how much?______________
Summary of Linear Transformations: Multiplying all numbers in the data set by a number causes_________________________________________ to change by a factor of _____________. Adding a value to all numbers in the data set causes _____________ to change by ____________. ______________ will not change because _____________________.
Putting it all together...compare 2 distributions with center, shape and spread
3) Calculate the mean and standard deviation of Bryce's grade. 4) Calculate the mean and standard deviation of Brianna's grade. 5) Would you change your recommendation of who should get the award after computing the mean and standard deviation?