Download
1 / 19
190 likes | 321 Views
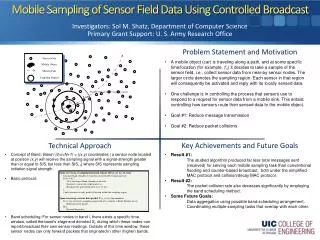
Utility-Driven Spatiotemporal Sampling using Mobile Sensors. Yang Yu, Loren J. Rittle Pervasive Platforms and Architectures Lab, Application Research Center, Motorola Labs INFOCOM 2008 2009.05.25 Junction. Outline. Introduction Contribution System model Utility-Driven Mobility Scheme

E N D
Utility-Driven Spatiotemporal Sampling using Mobile Sensors Yang Yu, Loren J. Rittle Pervasive Platforms and Architectures Lab, Application Research Center, Motorola Labs INFOCOM 2008 2009.05.25 Junction
Outline • Introduction • Contribution • System model • Utility-Driven Mobility Scheme • Simulation Results • Conclusion
Introduction • Mobile Sensor Nodes • Enable better sensing coverage with a relatively small number of nodes. • Enable a re-configurable network for better event sampling with a limited number of nodes
Contribution • Propose a parameterized sampling utility function to measure the sampling quality of an event • Event: priority and spatiotemporal properties • Sampling utility: Captures the information entropy of gathered sensor data as a concave function • Propose a community-based distributed protocol for mobility scheduling Maximizing the overall sampling utility in a network
System Model • Nodes are uniformly and independently distributed • Events ei: • Utility function • ei occurring at time duration • Pi: the set of nodes covering eiover Ti • Ci(t): the covered area of eiby Pi n mobile nodes { } events { } • pi: importance level • li: location of ei • ai: event area • di: time duration (exponential distribution with mean τi ) r 1 2 3 n 4 is an increasing, concave function capturing the information entropy of Ii, with The utility is maximized when enough nodes fully cover ai throughout Ti
System Model • Realistic Examples of Utility Function • f(I) depends on the joint entropy of samplings from multiple nodes. • Let κ denote the distance between two nodes 3 classes of f(I): E1: when the correlation coefficient is , f(I) scales as as E2: when the correlation coefficient is , f(I) scales as as E3: when samplings of sensor nodes are independent to each other, f(I) scales as as
Utility-Driven Mobility Scheme • Stable neighbors (s-neighbors) • If the expected link quality between them is above a pre-specified threshold • Maximum Neighboring Distance (MND)
Utility-Driven Mobility Scheme • Assumptions • All mobile nodes have unique ID and are capable of localizing and synchronizing themselves • All nodes are aware of the geographical shape of the field and the average time duration, τi , for every event. • All mobile nodes can move omnidirectionally, in a speed with expected value v. • Nodes covering an event are capable of evaluating the importance level and utility function of the event. • The wireless communication range is larger than the sensing range.
Utility-Driven Mobility Scheme • Based on community • Behaves as a basic operation unit changing information • Consist of two fundamental operations: • Discovery operation • Recruit operation
Discovery Operation • DIS packet (location, sensor reading) • Disperse (MND, event boundary) • Form community (leader) • collecting sensor readings • location information • Derive the utility function 1 2 3 n 4 community
Recruit Operation • Broadcast RM (Recruit Message) • A leader decides that the c-event is not partially covered the time when the event is first discovered RM the time when the RM is sent out from Pi The amount of data samples gathered till time tis
Estimating PMU • PMU (Potential Marginal Utility) • Movement is only consider when c-event is partially covered, i.e., • Probability for ei to still exist by time tis+δ(δ=δ1+δ2)
Given: utility function The size of the community ziat time tis : number of nodes may also reach eiduring δ -> estimate PMU to cover ei as if all these qinodes will cover eiby time tis+δ • assuming the size of Pi increases linearly from zito zi+qi • expected data samples gathered for eiat time tis+δ is • then, PMU is estimated as • Receive RMs from multiple communities, it estimates the PMU for each community and choose one with probability If G(I,a) > Gth: cover ei
Operation Detail • Adaptation to Event Dynamics • Updated RMs and re-evaluate PMU • Joining the Target Community • Broadcast a hello message and coordinate with other members to improve the coverage • Balance of Event Sensing and Network Coverage • Certain opportunistic cost is paid by switching to sense existing events • Gth as a way of modeling the opportunistic cost • Efficient Propagation of RMs • To avoid overwhelming communication cost • Counter-based flooding technique TTL • Post-event Movement
Simulation Results • Implementation of UMD • Modify the packet-level TOSSIM to support both synchronized node mobility and customized ADC sensing interface. • The link quality between nodes was re-established using the TOSSIM’s empirical model • Use ADC channels to distinguish various event types • All nodes performed synchronized ADC sensing at every second
Simulation Results UDM has significant utility improvement: 22-114% over stationary 13-56% over random mobility • Events: k=30, start time was uniformly chosen between [0,200] • Time duration: exponential distribution with τi=30 • Gth=0.1
Simulation Results • Up to 13%, 45% and 128% improvement over the stationary deployment • Up to 7% 20% and 63% improvement over the random mobility scheme • For E1, E2, E3 respectively
Conclusion • Propose a parameterized utility function to model the spatiotemporal sampling quality of events. • Provide a utility-driven mobility scheme, UDM • Distribute computing and autonomous decision making • Robustness to node and communication failures • Simulation results demonstrate significant utility improvement of UDM over both stationary and random mobility schemes.