Download
1 / 150
1.5k likes | 1.67k Views
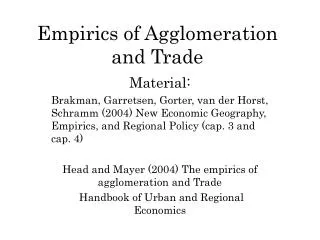
Understanding The Empirics Of Financial Volatility. Outline. Volatility is big Volatility is bad Volatility in a neo-classical setting What may be missing? Alternative explanations. What is Volatility ?. Instability Uncertainty. How to measure volatility?. Level vs. rate of change

E N D
Outline • Volatility is big • Volatility is bad • Volatility in a neo-classical setting • What may be missing? • Alternative explanations
What is Volatility ? • Instability • Uncertainty
How to measure volatility? • Level vs. rate of change • GDP vs. GDP growth • RER vs. RER change • Actual change vs. “unexpected change” • Trend, AR(1), model • E.g. the case of RER • Alternative measurements • Standard deviation of level • Standard deviation of rate of change • Standard deviation of deviations from trend or fitted values • Standard error of the equation • Other dimensions of “deviation” • Mean vs. median when doing international comparisons • Mean reversion and the role of frequency
Volatility is big Standard Deviation of Latin America Industrialized East Asian Countries Miracles Macroeconomic Outcomes Real GDP growth 4.2 2.2 3.1 Consumption Growth 5.6 2.1 4.1 Change in RER 13.4 4.8 6.2 Inflation Rate 463.5 3.9 6.2 Policy Fiscal Deficit (%GDP) 4.7 2.4 2.4 Monetary Growth 211.1 5.6 13.6 External Shocks Terms of Trade Change 15.1 8.9 8.0 Int’l Capital Flows (%GDP) 2.8 1.7 1.5
Crises in developing countries are nastier Table 2: Summary Statistics of Crises by Region Number of Standard 25th 75th Observations Mean Deviation Minimum percentile Median percentile Maximum Duration of Crisis Africa 151 8.14 10.09 1 1 3 13 43 Asia 42 4.79 5.71 1 1 2 7 24 Central and Eastern Europe 34 9.74 6.38 1 1 12.5 15 19 East Asia and Pacific 46 3.78 4.23 1 1 2 5 20 Industrialized 90 2.52 2.88 1 1 2 3 19 Latin America and Caribbean 109 6.88 8.92 1 1 3 7 34 Middle East and North Africa 63 5.13 7.56 1 1 2 4 27 Total 535 6.05 8.02 1 1 2 7 43 Peak to Through Africa 151 0.13 0.16 0.00 0.02 0.06 0.19 0.95 Asia 42 0.08 0.12 0.00 0.02 0.04 0.08 0.52 Central and Eastern Europe 34 0.29 0.24 0.00 0.06 0.29 0.45 0.77 East Asia and Pacific 46 0.08 0.08 0.00 0.02 0.05 0.11 0.35 Industrialized 90 0.02 0.03 0.00 0.01 0.01 0.03 0.13 Latin America and Caribbean 109 0.10 0.13 0.00 0.01 0.05 0.15 0.62 Middle East and North Africa 63 0.12 0.20 0.00 0.01 0.04 0.12 0.91 Total 535 0.11 0.16 0.00 0.01 0.04 0.13 0.95 Product-Years lost (Integral) Africa 151 1.42 2.94 0.00 0.02 0.10 0.93 16.40 Asia 42 0.51 1.16 0.00 0.02 0.07 0.26 5.51 Central and Eastern Europe 34 2.71 2.81 0.00 0.06 2.15 4.03 9.79 East Asia and Pacific 46 0.31 0.54 0.00 0.02 0.07 0.26 2.46 Industrialized 90 0.07 0.16 0.00 0.01 0.02 0.06 1.16 Latin America and Caribbean 109 1.05 2.35 0.00 0.01 0.06 0.62 13.78 Middle East and North Africa 63 1.16 2.88 0.00 0.01 0.06 0.20 12.73 Total 535 1.00 2.36 0.00 0.01 0.06 0.44 16.40
The real exchange rate is much more volatile at 1 & 5-year horizons 1YR 5YRS Volatility Volatility Developing 1.292 1.283 Industrial 0.506 0.513 Difference 0.786 0.770 t-statistic 4.262 4.818 P (Dev > Ind) 1.000 1.000
Volatility of Real Exchange rate over 5-year periods 4.5 Industrialized countries Developing countries Nigeria 4 3.5 Bolivia 3 Romania 2.5 Zambia Venezuela Ecuador China Uruguay Dominican Republic 2 Trinidad and Tobago Burundi Cote d'Ivoire Indonesia Argentina Cameroon Colombia Saudi Arabia Paraguay Kuwait Mexico Chile South Africa Brazil 1.5 Bahrain Pakistan Peru Malaysia Portugal United States Singapore Turkey India Hungary New Zealand Hong Kong, China Fiji United Kingdom Tunisia St.Vinc&Grenadines Costa Rica Philippines Papua New Guinea Thailand 1 Australia Togo Morocco Gambia, The Belize Japan Korea, Rep. Finland Belgium Lesotho St. Lucia Spain Italy Iceland Switzerland Sweden Bahamas, The Germany Malta Cyprus Greece Taiwan Netherlands Canada Denmark France Austria Israel Ireland 0.5 Norway 0
Volatility is bad • It is bad for growth • Excess volatility (relative to OECD) accounts for 1 percent less growth in LAC • It is bad for inequality • It is bad for poverty • It is bad for educational attainment
Volatility and inequality Hausmann and Gavin (1996)
Should volatility be bad? • Arrow-Debreu • If there are complete insurance markets, then volatility should not affect welfare • So you need to argue some form of market incompleteness
Should volatility be that costly? • Assume no insurance markets but good financial markets • …then volatility should not be that big of a problem • There are shocks • Terms of trade, natural phenomena, technology • People smooth consumption • Borrow in bad times, pay back in good times • Anti-cyclical finance • Governments smooth tax rates, spending • Anti-cyclical fiscal policy, deficits • Country smoothes domestic demand • Borrow in bad times, pay back in good times • Anti-cyclical international finance
In the real world • Bank lending looks pro-cyclical • Fiscal policy looks pro-cyclical • Capital flows look pro-cyclical
Country group 1960 - 98 1960 - 1980 1980 - 1998 Number of countries All developing 1.7 3.0 0.2 115 - oil exporters 1.1 5.2 - 2.1 15 - others 1.8 2.7 0.5 100 Oil exporting countries: two decades of poor performance
Oil exporting countries have performed very poorly Saudi Arabia
Oil exporting countries have performed very poorly Productivity per worker, non-oil economy Venezuela
300 100 90 250 80 200 70 60 150 50 100 40 50 30 1950 1955 1960 1965 1970 1975 1980 1985 1990 1995 …accompanied by a collapse in capital per worker Output per worker Capital per worker Venezuela: non-oil private sector
35 30 25 20 Oil Revenues Real exchange rate 15 10 5 0 1950-82 1982-2000 …and a rise in real exchange rate volatility Volatility in: Venezuela
What might explain the “resource curse”? • Dutch disease? • Argues that oil booms cause contraction in manufacturing • But why did countries do so poorly when oil prices declined? • Rent-seeking • But why did countries do so well for so long? • Sparse forest? • Volatility • But what is the mechanisms?
Could oil income volatility really be a problem? • Assume perfect international mobility of capital • Assume perfectly mobile labor nationally • Assume three sectors • Oil: manna from heaven • Tradables: use capital and labor • Non-tradables: use capital and labor • Oil income is transferred to households Punchline • The production possibility frontier is flat. • Resources can move without changes in relative prices
The non-oil economy adjusts without any relative price movements or losses YT CTB YTA YTB YNA YNB YN THE BENCHMARK MODEL: THE DIVERSIFIED ECONOMY
Is volatility that serious? • Assume oil is 30 percent of GDP • Assume oil income volatility is 30 percent • Assume country is very risk averse • CRRA = 3 • Country would be willing to give up 4.1 percent of national income in order to eliminate uncertainty • But what would explain declines of 50 percent of national income?
Should we be talking of stabilization policies or should we talk about the “curse”?
Our central message • The “curse” is caused by the interaction of three factors: • Domestic spending of oil income • Mean and volatility • “Specialization” away from non-oil tradables • Financial frictions
Building blocks • Same as before • …but capital investments are made ex ante and are irreversible • By themselves this does not buy much • Government spends only in non-tradables • Consumers do not value government spending • To eliminate standard consumption smoothing argument for stabilization
Specialization YT Now, relative prices do have to move to induce expenditure switching CTB CTA YNA = YNB = THE BENCHMARK MODEL: THE SPECIALIZEDIED ECONOMY
Financial frictions • We assume that there is costly bankruptcy • Lenders are risk neutral and perfectly competitive • There is costly contract enforcement in case projects do not have enough money to pay back in full. • This makes interest rates go up with volatility • Lenders loose in the downside, but do not benefit from the upside. The larger the volatility, the larger the average premium they must charge • We assume that lenders can distinguish between tradable and non-tradable borrowers and charge a different interest rate
Anatomy of the curse • As the economy becomes more specialized • …relative prices become more volatile • …interest rates for tradables go up • …the tradable sector shrinks further • …making the economy even more specialized • …until the tradable sector disappears • …forcing an inefficient specialization • The economy is left in an environment of high volatility, high interest rates and low capital
The frontier of specialization Volatility Mean
Real exchange rate becomes dramatically more sensitive to volatility
300 100 90 250 80 200 70 60 150 50 100 40 50 30 1950 1955 1960 1965 1970 1975 1980 1985 1990 1995 Venezuela: the collapse in capital per worker Output per worker Capital per worker Venezuela: non-oil private sector
35 30 25 20 Oil Revenues Real exchange rate 15 10 5 0 1950-82 1982-2000 …and a rise in real exchange rate volatility Volatility in: Venezuela
Explaining the curse • Some countries became inefficiently specialized and were trapped by the curse • No expansion of non-oil exports after the collapse in oil • Venezuela, Nigeria • Collapse in capital per worker and output • Increase in real exchange rate volatility • More diversified countries were unaffected • Mexico, Indonesia
Three types of countries • Efficiently specialized countries • Countries that would specialize even if there were no financial frictions or no volatility • e.g. The Gulf states? • Inefficiently specialized • Countries that would diversify in the absence of financial frictions or volatility but are trapped by the curse • e.g. Nigeria, Venezuela • Diversified • Countries that have a large non-oil tradable sector • e.g. Ecuador, Indonesia, Mexico
Determinants of the frontier of specialization • Average (expected) “government spending” • Primary non-oil deficit • Volatility in government spending • Commercial “risk-free” interest rate • Can be interpreted to include “country” risk • Higher rates cause the economy to specialize at lower levels of spending and volatility