Download
1 / 29
290 likes | 375 Views
Nested Global and Regional aerosol and ozone assimilation and forecasting experiments during the NOAA CalNex field mission R. Bradley Pierce 1 , Todd Schaack 2 , Allen Lenzen 2 , Pius Lee 3 , Tom Ryerson 4 ,

E N D
Nested Global and Regional aerosol and ozone assimilation and forecasting experiments during the NOAA CalNex field mission R. Bradley Pierce1, Todd Schaack2, Allen Lenzen2, Pius Lee3, Tom Ryerson4, Ilana Pollack4,Owen Cooper4, Chris Hostetler5, Rich Ferrare5, David Winker5 1NOAA/NESDIS/STAR Advanced Satellite Products Branch, Madison WI 2UW-Madison Space Science and Engineering Center, Madison, WI 3NOAA ARL, Silver Spring, MD 4NOAA ESRL Chemical Sciences Division, Boulder, CO 5NASA Langley Research Center, Hampton, VA
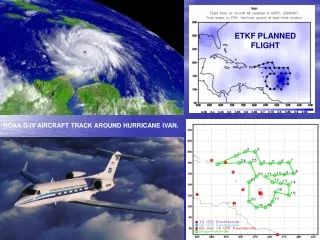
NOAA CalNex Field Mission During May-June 2010 the National Oceanic and Atmospheric Administration (NOAA) and the California Air Resources Board (CARB), conducted a joint field study of atmospheric processes over California and the eastern Pacific coastal region called CalNex emphasizing the interactions between air quality and climate change issues. NOAA WP-3D Flight Track Map http://www.esrl.noaa.gov/csd/calnex/
Online global chemical and aerosol assimilation/forecasting system • Real-time assimilation: • Microwave Limb Sounder (MLS) stratospheric ozone profiles (above 50mb) • Ozone Monitoring Instrument (OMI) total ozone column (cloud cleared) • Moderate Resolution Imaging Spectroradiometer (MODIS) Aerosol Optical Depth (AOD) • Real-time fire detection: • Moderate Resolution Imaging Spectroradiometer (MODIS) This talk presents results from post mission studies focused on: Evaluation of the RAQMS large-scale ozone and aerosol analyses using airborne, ground based, and satellite measurements during CalNex Evaluation of the RAQMS large-scale ozone and aerosol forecast skill. Nested RAQMS/WRF-CHEM aerosol assimilation studies Nested RAQMS/NAM-CMAQ ozone assimilation studies
CalNex-2010 O3 sondes – Owen Cooper (NOAA ESRL) CalNex Ozonesonde NO ASSIM RAQMS NO ASSIM is low biased up to 30% of Ozonesonde Tropospheric low bias
CalNex-2010 O3 sondes – Owen Cooper (NOAA ESRL) CalNex Ozonesonde MLS+OMI ASSIM RAQMS MLS+OMI analysis is within 20% of Ozonesonde Reduced tropospheric bias
Comparison with NOAA P3 Insitu O3 Measurements (Primarily LA Basin/Central Valley) No Assim MLS+OMI Assim Assimilation of MLS+OMI O3 retrievals results in increased lower-tropospheric O3 (and improved agreement with airborne insitu O3) over Southern California Insitu O3 from Tom Ryerson, NOAA ESRL
CALIPSO and Co-located RAQMS AOD May-June 2010 V3-01 aerosol profile retrievals 5o Lat, 10o Lon, 1km bins CAD< -20, COT=0.0 QC=0,1 (unadjusted retrievals) Clear sky CALIPSO scenes are dominated by Saharan Dust and South Asian emissions during May-June 2010 RAQMS overestimates Saharan Dust and SE Asian and S African biomass burning AOD relative to CALIPSO during May-June 2010 New 1x1 degree Re-analysis with Corrected dust and Sea-salt aod calculation Dave Winker, NASA LaRC
CALIPSO vs. RAQMS Extinction 13:52Z 06/01/2010 RAQMS 1x1 Degree Re-analysis Captures Structure of Dust Plume very well
CALIPSO vs. RAQMS Extinction 03:12Z 06/01/2010 RAQMS 1x1 Degree Re-analysis Captures Structure of Dust Plume Very well
CALIPSO vs. RAQMS Extinction 04:51Z 06/01/2010 RAQMS 1x1 Degree Re-analysis underestimates Dust Extinction away from source
CALIPSO and Co-located RAQMS AOD May-June 2010 V3-01 aerosol profile retrievals 5o Lat, 10o Lon, 1km bins CAD< -20, COT=0.0 QC=0,1 (unadjusted retrievals) Clear sky CALIPSO scenes are dominated by Saharan Dust and South Asian emissions during May-June 2010 RAQMS overestimates Saharan Dust and SE Asian and S African biomass burning AOD relative to CALIPSO during May-June 2010 New 1x1 degree Re-analysis with Corrected dust and Sea-salt aod calculation Dave Winker, NASA LaRC
Comparison with HSRL Lidar Measurements (Primarily LA Basin, Chris Hostetler, NASA LaRC) RAQMS free tropospheric median aerosol extinction is in very good agreement with HSRL Variability is underestimated, particularly for lower values of aerosol extinction Largest biases are found within the LA Basin Boundary Layer (below 1000m) were RAQMS median extinction is low
Assessment of Global 850mb O3 and Aerosol Extinction Forecast Skill • Anomaly Correlations (AC) • Correlation between forecast and analysis • May-June mean removed • Spectrally truncated to wavenumber 20 • Averaged from 20N-80N useful Skill http://www.emc.ncep.noaa.gov/gmb/STATS/html/monarch.html
Northern Hemisphere 850mb May-June 2010 Anomaly Correlations (AC) (No Assimilation) useful Skill • 850mb ozone forecasts have useful skill past 3 days (significantly better than water vapor) • 850mb extinction forecasts do not have useful skill at 1 day
Northern Hemisphere 850mb May-June 2010 Anomaly Correlations (AC) (With MLS/OMI/MODIS Assimilation) useful Skill • Assimilation of O3 retrievals results in slight improvements in 850mb ozone forecasts • Assimilation of AOD retrievals results in significant improvement in 850mb extinction • forecasts with useful skill at ~1.5 days
Northern Hemisphere 850mb May-June 2010 Anomaly Correlations (AC) (No Assimilation) useful Skill • Only 850mb SO4 extinction forecasts useful skill past 1 day • Black and organic carbon (BC+OC) and dust extinctions are both poorly initialized and • forecasted
Northern Hemisphere 850mb May-June 2010 Anomaly Correlations (AC) (With MODIS Assimilation) useful Skill • MODIS AOD assimilation results in small changes in 850mb SO4 extinction forecasts • MODIS AOD assimilation results in significant improvements in black and organic carbon (BC+OC) and dust forecast skill (dust prediction useful at 2 days)
RAQMS/WRF-CHEM May-June 2010 aerosol analysis GOCART aerosol module, MODIS AOD assimilation, Two nests: 36km and 12km 12km WRF-CHEM 00Z-24Z May 31st, 2010
WRF-CHEM 12km (NO ASSIM) vsAeronet Note: need to cloud clear WRF-CHEM analysis to account for miss match between observed and predicted clouds
WRF-CHEM 12km (MODIS ASSIM) vsAeronet • MODIS AOD assimilation does not have a significant impact on regional scale • AOD over CONUS during May-June 2010 • Assimilation results in slight reduction in correlation and slight increase in RMS error
Development of GOES Total Column Ozone Assimilation Within Operational NAM-CMAQ We currently developing capabilities to assimilate GOES Sounder TCO retrievals into the Community Multi-scale Air Quality (CMAQ; http://www.cmaq-model.org/) model using the NCEP Grid-point Statistical Interpolation (GSI) analysis scheme. GOES provides hourly TCO during day and night. OMI daytime TCO is used for bias correction
Three NAM-CMAQ/GOES TCO Experiments have been conducted: • RAQMS Lateral Boundary Conditions/default background errors • Fixed Lateral Boundary Conditions/default background errors • Fixed Lateral Boundary Conditions+GFS UT/LS/GFS background errors Fixed LBC underestimates TCO, Fixed LBC+GFS UT/LS overestimates TCO
CalNex-2010 O3 sondes – Owen Cooper (NOAA ESRL) CalNex Ozonesonde RAQMS LBC and default background errors results in free tropospheric overestimates but good PBL and UT/LS FIXED LBC and default background errors results in free tropospheric and PBL overestimates with UT/LS underestimates FIXED LBC+GFS UT/LS and GFS background errors results in best agreement with IONS ozonesonde RAQMS LBC Default Background Errors FIXED LBC Default Background Errors FIXED LBC +GFS UT/LS GFS Background Errors
Current Directions • Work with NOAA Air Resources Lab and the National Air Quality Forecasting Capability team to test impact of improved vertical resolution on GOES TCO assimilation within NMMB-CMAQ • Work with NASA Air Quality Applied Science Team to implement 3D tropospheric POX/LOX within GFS to provide improved time-dependent lateral boundary conditions to NMMB-CMAQ • Evaluate the relative impacts of IASI ozone profile and ozone band radiance assimilation on GFS tropospheric ozone distributions • Focus on NASA DISCOVER-AQ mission timeframe (July 2011)
I would like to acknowledge Dr. DaewonByun’s personal contribution to this effort. He conducted the first experiments on assimilation of GOES TCO within CMAQ nearly a decade ago, and always provided enthusiastic support for using satellite measurements to improve regional air quality predictions. 2005 Benchmark Study conducted in collaboration with EPA/ORD (Alice Gilliland, Ken Schere) and the University of Houston Institute for Multidimensional Air Quality Studies (DaewonByun)