Download
1 / 6
60 likes | 65 Views
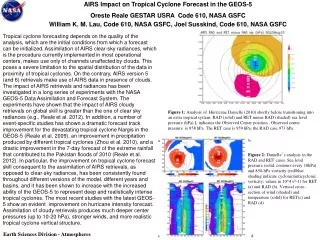
Geomagnetic/Ionospheric Models NASA/GSFC, Code 692. April 6-7, 2000: Predicted Dst Index. During the early part of April 6, 2000 a large coronal “ejecta” event compressed and interacted with the magnetosphere to produce a geomagnetic storm. In the course of the storm geomagnetic

E N D
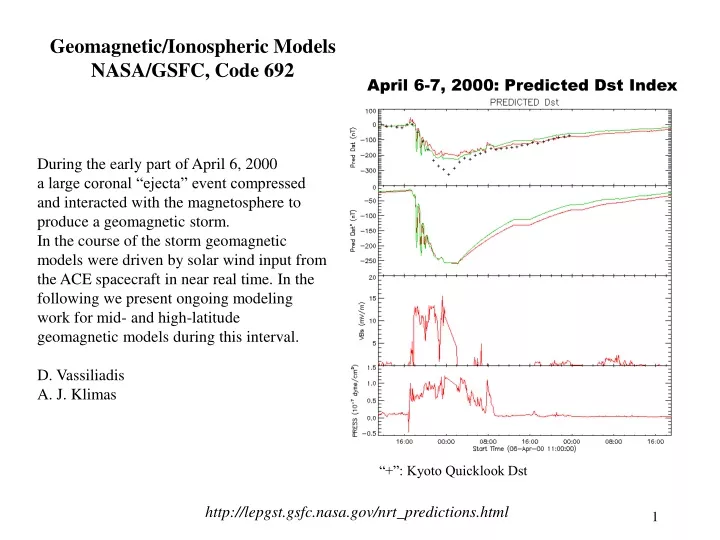
Geomagnetic/Ionospheric Models NASA/GSFC, Code 692 April 6-7, 2000: Predicted Dst Index During the early part of April 6, 2000 a large coronal “ejecta” event compressed and interacted with the magnetosphere to produce a geomagnetic storm. In the course of the storm geomagnetic models were driven by solar wind input from the ACE spacecraft in near real time. In the following we present ongoing modeling work for mid- and high-latitude geomagnetic models during this interval. D. Vassiliadis A. J. Klimas “+”: Kyoto Quicklook Dst http://lepgst.gsfc.nasa.gov/nrt_predictions.html
Method and Database Method: a) To predict an event, we identify the geomagnetic state of the high-latitude (polar and auroral) region. The state is further divided in local time bins. b) We search a geomagnetic/solar wind database for similar historical states. Use nonlinear dynamics theory to construct a local model, and obtain the future state and its stability properties. t+Dt t a) Database: 35 high-latitude ground magnetometers; magnetic indices, WIND measurements. Duration/Epoch: January-February 1995 Resolution: 1 min Model URL: http://lepgst.gsfc.nasa.gov/people/vassi/rt/spatio.html b)
Model Output Polar view of ground field, Bx comp. (Main Output) Highest latitude: 80º Lowest: 60º Electrojet currents + - Location of Min and Max disturbance in latitude and local time Input to model (here: PC index used in “nowcasting” mode) Derived AL, AU indices from IMAGE, MM210 chains Current time
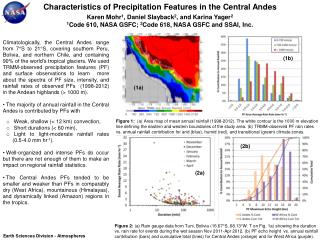
Auroral geomagnetic field pattern Geomagnetic Field Prediction with a Nonlinear Dynamical Model First 10 hours of storm, April 6, 2000 Model auroral geomagnetic indices Kyoto Quicklook Indices PC index (model input) Predicted AL saturates at ~-600 nT (limited by size of largest substorm currently in database.) Derived max, min indices from 2 magnetometer arrays
Model Predictions at Midnight Time Magnetic Field (Bx) Predictions at Meridional Cross-Sections • The positions of the ground • magnetometers define a • longitude-local-time grid. • We take cross-sections at • 2 meridional cross-sections • of the predicted field to • estimate the local equivalent • currents. To Sun Noon meridian Model Predictions at Noon Midnight meridian Negative Bx due to westward electrojet and substorm current wedge Positive Bx due to eastward electrojet Time
Summary * The April 6-7, 2000, solar wind ejecta and accompanying magnetic storm was studied as part of our developing mid- and high-latitude geomagnetic and ionospheric models. * The mid-latitude Dst index captured both the main and recovery phase of the storm rather well and thus modeled the dynamics of the magnetospheric ring current. It failed close to the peak of the storm; that may have been due to a temporary solar wind data gap, or a problem of the model. The model reproduced oscillations during the main phase which are linked to injections of particle into the ring current. * The high-latitude spatiotemporal model captured the qualitative aspects of polar cap expansion. The model database is still limited to small and moderate events, and so the model amplitude saturated quickly to -600 nT while the actual AL activity went further down to -1500 nT. We plan to increase the scope of the database.


![JN0-692 PDF [Updated] Enterprise Routing and Switching Exam PDF](https://cdn4.slideserve.com/7888336/juniper-dt.jpg)