Download
1 / 21
210 likes | 327 Views
Chris Morgan, MATH G160 csmorgan@purdue.edu April 4, 2012 Lecture 26. Chapter 3.1, 3.2, & 3.4: Summary Statistics. Mean (average) ● Range (max – min) Median (middle number) ● Interquartile range (Q3 – Q1) Mode (most frequent) ● Outliers Percentiles

E N D
Chris Morgan, MATH G160 csmorgan@purdue.edu April 4, 2012 Lecture 26 Chapter 3.1, 3.2, & 3.4: Summary Statistics
Mean (average) ● Range (max – min) • Median (middle number) ●Interquartile range (Q3 – Q1) • Mode (most frequent) ● Outliers • Percentiles • Quartiles (1st, 2nd - median, 3rd) • Five number summary (minimum, maximum, and Q1, Q2, Q3) Types of Measurements • Mean vs Median: • Median is robust to outliers and is unaffected by skewness • Use mean if data is normally distributed (bell-curve)
Box plot and five-number summary • Minimum, Q1, Median, Q3, Maximum • If you can’t find the minimum, umm….yea. • Median: • Number such that half the observations are lower and half the observations are higher • Arrange observations from small to large • Find middle number
The number of times a day I think to myself, “Damn, wheat thins are delicious.” 5 4 8 6 7 2 9 4 10
The number of times a day I think to myself, “Damn, wheat thins are delicious.” 2 4 4 5 6 7 8 9 10
The number of times a day I think to myself, “Damn, wheat thins are delicious.” 2 4 4 5 6 7 8 9 10
The number of times a day I think to myself, “Damn, wheat thins are delicious.” 2 4 4 5 6 7 8 9 10
The number of times a day I think to myself, “Damn, wheat thins are delicious.” 2 4 4 5 6 7 8 9 10
The number of times a day I think to myself, “Damn, wheat thins are delicious.” 2 4 4 5 6 7 8 9 10
The number of times a day I think to myself, “Damn, wheat thins are delicious.” 2 4 4 5 6 7 8 9 10
The number of times a day I think to myself, “Damn, wheat thins are delicious.” Since 6 is a the true median, we will not use it to find Q1 and Q3 2 4 4 5 6 7 8 9 10 Had there been an even number of observations, see next slide 2 4 4 5 7 8 9 10
If there were an even number, the median would be 6.5 and we would use 6 and y to find Q1 and Q3 respectively Median = 6.5 2 4 4 5 6 6.5 7 8 9 10 11 2 4 4 5 6 Q3 would now be 9 7 8 9 10 11 Q1 would now be 4
Back to original example….The number of times a day I think to myself, “Damn, wheat thins are delicious.” Median = 6 2 4 4 5 6 7 8 9 10 2 4 4 5 Q3 = (8+9)/2 = 8.5 Q1 = 4 7 8 9 10
Outliers An outlier in any graph of data is an individual observation that falls outside the overall pattern of the graph Q1 - 1.5 * IQR [IQR = Inter-Quartile Range] Q3 + 1.5 * IQR Q1 = 4, Q3 = 8.5, so Q3 – Q1 = 4.5 = IQR 1.5* IQR = 1.5*4.5 = 6.75 Observations > Q3 + 6.75 OR < Q1 – 6.75 are outliers Then: -2.75 = 4-6.75 and 15.75 = 8.5+6.75, so outliers are values less than -2.75 or more than 15.75
Boxplots Modified Boxplots: - “whiskers” extend to the ‘test for outliers limits’, with the outliers as asterisks Regular Boxplots: - “whiskers” extend to the min and max
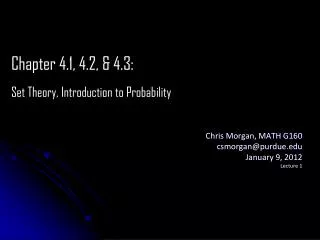
Distributions A distribution is symmetric if the right and left sides of the histogram are approximately mirror images of each other A distribution is skewed to the right if the right side of the histogram (containing the half of the observations with larger values) extends much farther out than the left side Distribution is skewed left if…
SKEWED RIGHT SKEWED LEFT
Mean The mean is found by taking the sum of the observations divided by the total number of samples
Standard Deviation (σ) and Variance (σ²) σ is the standard deviation which measures the average distance of the observations from their mean, and is calculated by finding the average of the squared distances and then taking the square root
Choosing a Summary We have two ways to summarize data, so when should we use which? Mean and Standard Deviation when normally distribute as these measures are largely effected by outliers and skew ness Five-number summary is usually better for skewed distributions, distributions with outliers