Download
1 / 19
190 likes | 279 Views
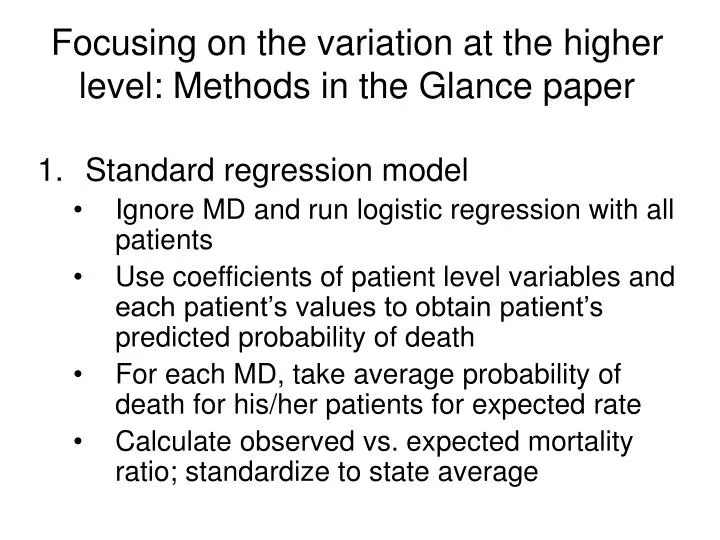
Focusing on the variation at the higher level: Methods in the Glance paper. Standard regression model Ignore MD and run logistic regression with all patients Use coefficients of patient level variables and each patient’s values to obtain patient’s predicted probability of death

E N D
Focusing on the variation at the higher level: Methods in the Glance paper • Standard regression model • Ignore MD and run logistic regression with all patients • Use coefficients of patient level variables and each patient’s values to obtain patient’s predicted probability of death • For each MD, take average probability of death for his/her patients for expected rate • Calculate observed vs. expected mortality ratio; standardize to state average
Methods in the Glance paper • Fixed effects regression model with an indicator variables for each MD (less one) • Can’t just exponentiate coefficients from indicator variables for each MD • Calculate predicted MD mortality rate from patients predicted probability adding term for providers coefficients weighted by provider’s proportion of patients • Form observed versus expected ratio as with standard model
Methods in the Glance paper • Random effects regression model: Two methods from RE model • Used fixed effects patient coefficients as in standard model to obtain each MD’s predicted mortality rate and form observed/expected ratio • Use “shrinkage estimates” for each MD from the RE model; exponentiate coefficient for each MD to get individual odds ratios relative to the average MD
Methods in the Glance paper Ranking outliers from the statistical models: • Calculate upper and lower 95% CI of O/E for each MD using standard error of each MD’s mean assuming a Poisson distribution • Obtain from CI of O/E by bootstrapping, stratified by MD • Only used with standard regression model • Exponentiate 1.96 x SE of each MD’s shrinkage estimate to get 95% CI of OR
Methods in the Glance paper Three methods for comparing agreement among the models: • Kappa statistic • Calculate ICC using ANOVA • Compare the size of the confidence intervals
Effect of shrinkage versus fixed effects estimates in Glance et al. • 16 of 127 MDs outliers in all models • 4 more outliers with FE but only 1 with RE • 3/20 (15%) classified differently by shrinkage • 2 of 29 hospitals outliers in all models • 3 more outliers with FE but 0 with RE • 3/5 (60%) classified differently by shrinkage
Conclusions in Glance • “Shrinkage estimators...more precise...at the cost of introducing bias...may also have substantial limitations” • “Fixed effects...will result in unbiased estimates...when provider effects are correlated with...patient risk factors” • “Bootstrap...was...less conservative in classifying providers as quality outliers”
Characteristics of Fixed (FE) versus Random Effects (RE) • FE models control for or remove the association between the higher level variable and the outcome • Indicator variable gives a separate intercept for each unit • Conditional regression “conditions out” the effect of the higher level variable • In both cases, cannot look at association with variables of higher level characteristics
Characteristics of Fixed (FE) versus Random Effects (RE) • RE models can have variables for higher level characteristics • RE model the variance distribution of the higher level variable independently of lower level variables: • Model may be biased if a lower level variable is associated with the random effect
Characteristics of Fixed (FE) versus Random Effects (RE) • FE models control unmeasured confounding of higher level units • RE more precise than FE because uses all variance (not just within cluster variance) • Common trade-off in statistics: more precision more potential for bias
Example: FE vs. RE when lower level variable associated with higher level • Calif. CABG data set modified by adding a patient variable “x” whose true coef. = 1.0 • Variable X is strongly associated with hospital • FE indicator variable model compared to GEE and RE models
Estimate of X (true value=1.0): 3 Models 1) Fixed effects regression xi: logit y x i.hospid yCoef.Std. Err. x 1.03 .0848 2) GEE regression xtlogit y x, pa i(hospid) yCoef.Std. Err. x 0.93 .0778 3) Random effects regression xtlogit y x, re i(hospid) yCoef.Std. Err. x 1.20 .0860
Estimate of X (true value=1.0), adjustingGEE and RE models for prevalence of X among the hospitals 4) GEE regression adj for prx xtlogit y x prx, pa i(hospid) yCoef.Std. Err. x 1.02 .0854 5) Random effects regression adj for prx xtlogit y x prx, re i(hospid) yCoef.Std. Err. x 1.02 .0844
Choosing a Model for Multilevel Data • Regression model ignoring higher level variables • Regression model with an indicator variable for each level 2 unit (minus one) • Conditional regression model • Regression model with generalized estimating equations (GEE model) • Random or mixed effects regression model
Choice of Analysis Model: Three Main Considerations • What is the research question? • How many observations are there at each level of the data? • How important is controlling unmeasured confounding at the higher level?
Research Question Targets • Association of lower level measurements with outcome • Association of higher level variable measurements with outcome • Variation at higher level • Whether coefficient of a measurement varies signficantly at either level
What Model Would You Use? • Clinical trial with 10 centers, 400 subjects, characteristics of centers and subjects • Case-control study, 200 CABG surgeons, one patient who died and one who didn’t from each MD, characteristics of patients
What Model Would You Use? • Cross-sectional study of patient satisfaction with MD, 70 MD’s, 1500 patients, characteristics of MD’s and patients • Cross-sectional study patient bp, 400 MD’s and 400 patients (1 per MD), characteristics of MD’s and patients
What Model Would You Use? • Cross-sectional study of patient mortality 100 hospitals, 20,000 patients, patient characteristics, RQ is whether patient age predicts mortality differently among hospitals • Cross-sectional study of patient days in hospital, 50 hospitals, 4000 patients, patient characteristics, suspect significant unmeasured confounding by hospital