Download
1 / 6
60 likes | 209 Views
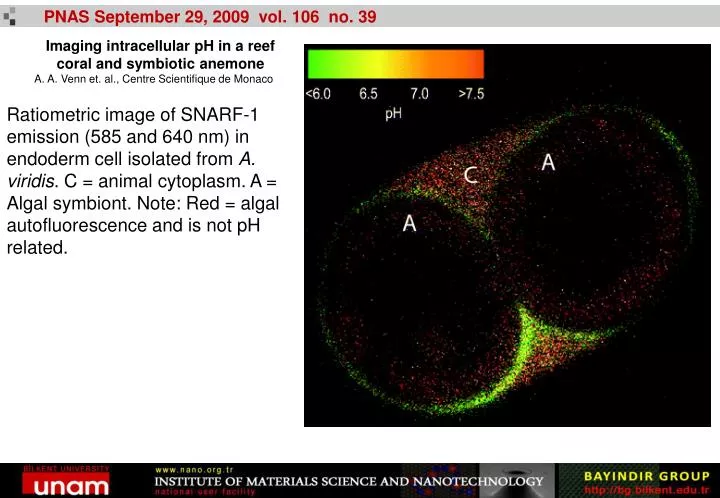
PNAS September 29, 2009 vol. 106 no. 39. Imaging intracellular pH in a reef coral and symbiotic anemone A. A. Venn et. al., Centre Scientifique de Monaco.

E N D
PNAS September 29, 2009 vol. 106 no. 39 Imaging intracellular pH in a reef coral and symbiotic anemone A. A. Venn et. al., Centre Scientifique de Monaco Ratiometric image of SNARF-1 emission (585 and 640 nm) in endoderm cell isolated from A. viridis. C = animal cytoplasm. A = Algal symbiont. Note: Red = algal autofluorescence and is not pH related.
PNAS September 29, 2009 vol. 106 no. 39 A mathematical model of ischemic cutaneous wounds C. Xue et. al., Ohio State University Modeling early retinal development with human embryonic and induced pluripotent stem cells J.S. Meyer et. al., University of Wisconsin-Madison Fig. 1. Commitment toward a retinal lineage occurs as a stepwise process, beginning with the establishment of the eye field within the anterior neuroepithelium. (A) Each major stage in retinogenesis can be distinguished in part by the expression of various transcription factors. (B) Schematic of the differentiation protocol used to generate cells of a retinal lineage. (C) RT-PCR analysis of the changes in gene expression toward an eye field fate through the first 16 days of differentiation. (D–F) Immunocytochemistry of typical hESC aggregates 10 days after differentiation, demonstrating the expression of the anterior neural transcription factor Otx2 (D), the eye field transcription factor Lhx2 (E), and the definitive neural transcription factor Sox1 (F). (Scale bar, 200 μm.) Comparison of experimental data (A,C) and simulation (B,D). (▪) ischemic wound; (•) nonischemic wound.
Lab on a Chip 2009, 9 A multiplexed optofluidicbiomolecular sensor for low mass detection S. Mandal et al., Cornell University (a) 3D rendering of the NOSA device showing two 1-D photonic crystal resonators evanescently coupled to a silicon bus waveguide. The first resonator is immobilized with an antigen whereas the second resonator acts as a control. (b) 3D rendering illustrating the association of the corresponding antibody to the antigen immobilized resonator (not drawn to scale). (c) Experimental data illustrating the successful detection of 45 µg/ml of anti-streptavidin antibody. The blue trace shows the initial baseline spectrum corresponding to Figure 1a where the first resonator is immobilized with streptavidin. The red trace shows the test spectra after the association of anti-streptavidin as shown in Figure 1b. The resonant wavelength of the control is unchanged while that of the streptavidin immobilized resonator red-shifts appreciably indicating successful detection of anti-streptavidin. (d) Finite difference time domain (FDTD) simulation of the steady state electric field distribution within the 1-D photonic crystal resonator at the resonant wavelength. (e) SEM image demonstrating the 2-dimensional multiplexing capability of the NOSA architecture.
Lab on a Chip 2009, 9 Leukocyte analysis and differentiation using high speed microfluidic single cell impedance cytometry D.Holmes et. al, University of Southampton, Philips Research Laboratories Schematic diagram of the micro impedance cytometer system, including the confocal-optical detection setup. Dual laser excitation and three colour detection were implemented along with dual frequency impedance measurement. The cell flows through the microchannel and passes between two pairs of electrodes and the optical detection region. The fluorescence properties of the cell are measured simultaneously with the impedance allowing comparison of the electrical and optical properties on a cell-by-cell basis.
ACS Nano 2009 3 (9) A Simple Route for the Preparation of Mesoporous Nanostructures Using Block Copolymers D. Chen et. al., University of Massachusetts, Ulsan Institute of Science and Technology, Cornell University Mesoporous nanostructures of poly(styrene-b-4-vinylpyridine) formed from nanoscopic wormlike micelles using solvent-induced reconstruction. Such mesoporous nanostructures can be converted into inorganic oxide tubes, such as silica and titania, by well-known sol−gel methods. These tubes have applications ranging from filtration media to nanocomposite materials to photovoltaics Figure: Electron micrographs of mesoporous ceramics prepared from PS(47.6k)-b-P4VP(20.9k) (A) SEM image of the mesoporous silica tubes, (B) TEM image of the mesoporous silica tubes, (C) SEM image of the mesoporoustitania tubes, and (D) TEM image of the mesoporoustitania tubes.
ACS Nano 2009 3 (9) Light Extraction with Dielectric NanoantennaArrays G. Pellegrini et. al., University of Padova SiO2 and TiO2 dielectric nanoparticles are arranged in linear arrays, supporting collective Bragg modes, and employed as dielectric nanoantennae. Electrodynamic calculations show that strong, tunable, and lossless light extraction is obtained in a wide spectral range, including UV, visible, and near-infrared regions, in opposition to poor enhancement features of isolated dielectric nanoparticles. Emission quantum efficiencies comparable to those obtained employing metallic structures are achieved, with strong emission enhancement even for poor emitter position and dipole moment orientation.