Download
1 / 27
270 likes | 287 Views
Graphing the Sine and Cosine Functions. Dr. Shildneck Fall. Graphing the Basic Sinusoidal Curves. Know where your primary w ave Begins What is the first point of the wave? Know How Long your primary wave is What is the period of the wave? (How long is one cycle?)

E N D
Graphing the Sine and Cosine Functions Dr. Shildneck Fall
Graphing the Basic Sinusoidal Curves • Know where your primary wave Begins • What is the first point of the wave? • Know How Long your primary wave is • What is the period of the wave? (How long is one cycle?) • Know the Patternof your primary wave • What are the maximums, minimums, and zeros (x-intercepts)?
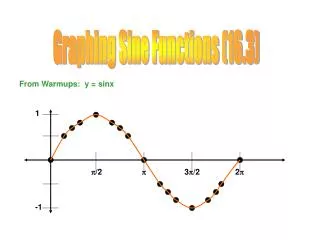
The “Half-Way-In-Between” Method • Plot the first point of the wave • Go out the length of one cycle from that point and plot another point at the same level (y-value). • Use the Patternof the function • Plot the point half way in between those points • Plot the point half way in between the first and middle point • Plot the point half way in between the middle and last point • Sketch the curve using those 5 points.
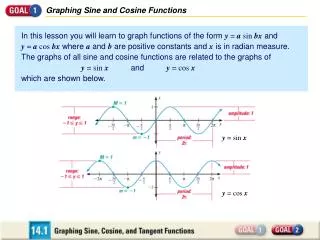
Transformations • Amplitude • The amplitude of a periodic wave function is its maximum displacement from the central line (sinusoidal axis) running through the middle of the wave. The amplitude of the function is the absolute value of the coefficient of the function. Given or The amplitude =
Transformations • Period • The PERIOD of a periodic function is “how long” the function takes to repeat itself. • The time it takes to go through one complete CYCLE. • For graphing, it is helpful to think of the period as the length of the primary wave. • For the basic Sine and Cosine functions, how long does it take until the values begin to repeat themselves (in order)?
Transformations • Period • In the functions and , the value of b tells us how many waves occur during the NORMAL period of the standard function. • Thus, in order to find the wavelength of a function take the normal period and divide it by how many waves occur within that time. This will give you how long one wave is.
Transformations • The Phase Shift • The PHASE SHIFT of a periodic function is the horizontal (Left/Right) shift of the function. • For graphing, this tells us where the initial point has moved horizontally. • Remember that for horizontal shifts, the graph moves “the opposite direction from what you see.”
Transformations • The Vertical Shift • The VERTICAL SHIFT of a periodic function is how much the function is moved up or down. • For graphing, this tells us where the SINUSOIDAL AXIS is. • When shifting a function vertically, we “transfer” the x-axis to the location of the sinusoidal axis.
Compounded Transformations • When having multiple transformations for a graph follow this order: • Factor out the coefficient of the variable if there is one. • Apply the VERTICAL SHIFT and get your sinusoidal axis. • Apply the Amplitude (you can sketch two lines that show you the max and min values of your wave to help you. • Apply the PHASE SHIFT to get your starting point. • Find the period, and move that far out from your starting point to get your final point. • Now do “Half-Way In Between.”
Compounded Transformations Factoring out the coefficient of the variable if there is one. The function might be presented to you in one of two ways: Note the location of the coefficient of x If the x has been factored out from the inside (#2) then the added/subtracted amount is the phase shift. If the x has been distributed (inside), then you must factor it out to determine the phase shift.
Last Things • If the leading coefficient (of the function) is negative, there is a vertical reflection (across the x-axis) just as there is in other functions. To graph, just flip the pattern you would normally use. • If the leading coefficient of the variable (x, theta) is negative, there is a horizontal reflection (across the y-axis). To graph these, just graph to the left instead of to the right.
Try One! • Graph
How do we graph the other Trig functions? • Tangent What is the period of tangent ? When does it repeat itself in order? Where is it undefined? These are the asymptotes! Since Tangent is = , it is undefined wherever cos
The Tangent Curve • What does tan do as approaches ? • As it approaches from zero? • Using a variation of the Half Way In Between Method, plot the point half way between the asymptotes and then half way between that point and each asymptote.
Cotangent • Where is cotangent undefined? Remember that cotangent will be . • Use the same method as before to generate the Cotangent curve.
Secant and Cosecant • Recall that Cosecant and Secant are the reciprocals of Sine and Cosine respectively. • Graph . On the same graph, choose points every , and plot new points that correlate to . • Do the same for Cosine.
Cosecant and Secant • To plot any Secant or Cosecant function, we can plot its reciprocal (sine and cosine), place asymptotes where the reciprocal crosses the sinusoidal axis and graph the inverted curve between the asymptotes.
Assignment • Unit 4 Assignment 1 – Graphing Sine and Cosine • List all transformations for each problem. • Graph each function on graph paper of your choosing. **I will be posting Trigonometric Graph Paper on the blog for you if you wish to print and use it.