Download
1 / 36
360 likes | 465 Views
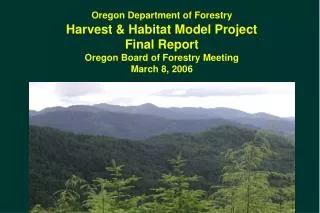
Oregon Department of Forestry Harvest & Habitat Model Project Final Report Oregon Board of Forestry Meeting March 8, 2006. Harvest & Habitat Model Project. Topics for Today Final Report Presentation Project overview Model strengths and limitations Comparison of alternatives

E N D
Oregon Department of ForestryHarvest & Habitat Model ProjectFinal ReportOregon Board of Forestry MeetingMarch 8, 2006
Harvest & Habitat Model Project • Topics for Today • Final Report Presentation • Project overview • Model strengths and limitations • Comparison of alternatives • Questions analyzed • Level of confidence • Where to from here?
Project Overview Purpose of the Project To provide information to assist decision-makers in: • Determining if changes should be made to ODF’s NW & SW Oregon Forest Management Plans • Determining whether to pursue a Habitat Conservation Plan • Establishing timber harvesting objectives for 7 ODF Districts (~ 632,000 acres)
Project Overview Scope of the Model Northwest & Southwest Oregon State Forest Management Plans 7 Districts Involved Astoria Tillamook Forest Grove West Oregon North Cascade Western Lane Southwest Oregon
Project Overview Organizational Structure 4-member ODF Exec Policy Team Legislature 10-member Policy Team Major Contracts Model Creation: Dr. Sessions Harvest Units-Roads Growth-Yield Tables GIS Information LFO (Legislative Fiscal Office)+ DAS (Dept. of Admin. Services)+ DSL (Dept. of State Lands) 5-member H&H Team 16-member Core Team FTLAC (Forest Trust Lands Advisory Committee) Other ODF District & Staff Personnel 10 Subcommittees
Project Overview Scope of Modeling Forestry Program for Oregon Greater Emphasis on Wood Production Greater Emphasis on Reserves The “Greatest Permanent Value” Social, Economic & Environmental Benefits Forest Management Plans Reserve-Based Alternative (Three North Coast Districts) Wood Emphasis Alternative (Three North Coast Districts) Forest Management Plan using an HCP Forest Management Plan using Take Avoidance (Seven Districts)
Project Overview Alternative Development
Project Overview Alternative Strategies
Project Overview Alternative Goals
Harvest & Habitat Model Project • Topics for Today • Final Report Presentation • Project overview • Model strengths and limitations • Comparison of alternatives • Questions analyzed • Level of confidence • Where to from here?
Model Strengths & Limitations • Model Strengths • Useful as strategic-tactical tool • Strategic-Tactical: long-term, district-wide harvest planning – i.e. Strategic level: FMP; Tactical level: District IPs • Useful because: • Ability to integrate multiple goals over time and space • Displays spatial location of harvest plan • Used updated input data • Developed with strong field involvement • Many options to fine-tune goals and constraints
Model Strengths & Limitations • Model Strengths (continued) • Many enhancements to 2000 model, including: • New – forest inventory and Swiss Needle Cast data • New – road layer and cost information • New – realistic harvest units linked to road system • New – model design structure • Updated – harvest prescriptions, costs, and revenues • Updated – spatial data • Addition of landscape design concepts • District involvement and implementation review
Model Strengths & Limitations • Model Limitations • Amount of stand level inventory • Use of strata-based inventory (explanation on next slide) • Model’s stand structure definitions • Many different model solutions meet the goals: finding the “best” is a challenge • Model included operational elements, but was not intended to be an operational tool • Operational: short-term, site-specific harvest plans – i.e. Annual Operation Plans
Model Strengths & Limitations Strata-Based Inventory – What is a “Strata”? • “Strata” average is different than specific stands Similar stands comprise a “strata” – some measured, some un-measured
Harvest & Habitat Model Project • Topics for Today • Final Report Presentation • Project overview • Model strengths and limitations • Comparison of alternatives • Questions analyzed • Level of confidence • Where to from here?
Comparison of Alternatives • Four Alternatives: 3 North Coast Districts Combined • FMP~HCP vs. FMP~TA vs. Wood Emphasis vs. Reserve-Based • Two Alternatives: 7 Districts Combined • FMP~HCP vs. FMP~TA
Comparison of Alternatives Four Alternatives: 3 North Coast Districts Combined • Key Findings Compared with FMP~HCP: • FMP~TA develops a similar amount of complex structure, but at a slower rate • Wood Emphasis develops about 10% complex structure • Reserve-Based develops 60% complex structure over 150 years, but at a slower rate due to less active management
Comparison of Alternatives Four Alternatives: 3 North Coast Districts Combined • Key Findings Compared with FMP~HCP: • FMP~TA produces more harvest volume in the first 30 years, but less volume over 150 years • Wood Emphasis produces twice the amount of volume in the first decade and more volume over 150 years because of: • 50-year harvest rotation • No goal for complex structure • Fewer acres in owl protection and riparian buffers • Reserve-Based produces about 40% less harvest volume
Comparison of Alternatives Summary Table: Harvest Volume Average Annual Volume (millions of bd. ft.) FMP~HCPFMP~TA* Wood Emphasis Reserve-Based 1st Dec150 Yrs1stDec 150Yrs1stDec150Yrs1stDec150 Yrs Ast 62 63 76 58 134 91 29 32 Till 61 62 73 57 113 92 39 41 FG 54 55 64 46 104 63 33 33 3 Sub: 177 180 213 161 351 246 101 106 NC 12 13 12 11 WO 12 14 12 12 WL 9 10 6 7 SW 2 2 2 2 4 Sub: 35 39 32 32 7 Grand Total 212 219 245 193 * Base NSO Population Scenario
Comparison of Alternatives 4 Alternatives: 3 North Coast Districts Combined Coarse Filter Wildlife Matrix • Background • Identifies acres of habitat, by period, for 37 North Coast wildlife species, 39 species for seven districts • Habitat characteristics based on review of scientific literature • Species grouped into classes • Generalist species – utilize multiple stand structures • Simple structure species – utilize REG and CSC stands • Complex structure species – utilize LYR and OFS stands
Comparison of Alternatives 4 Alternatives: 3 North Coast Districts Combined Coarse Filter Wildlife Matrix • Key Findings • All alternatives: Generalist species have similar amounts of habitat for most of the 150 years • Reserve-Based: Complex structure species have the most habitat acres; simple structure species have the least • Wood Emphasis: Simple structure species have the most habitat acres; complex structure species have the least
Comparison of Alternatives Two Alternatives: 7 Districts Combined • Key Findings Compared with FMP~HCP • FMP~TA produces more harvest volume for 7 districts over the first 30 years • Fewer acres are impacted by owls and murrelets • Impacts differ by District • TA reduces volume in 4 Southern Districts in first 30 years • TA increases volume in 3 North Coast Districts in first 30 years • FMP~TA produces less volume over 150 years • More acres are impacted by owls and murrelets • Develops complex structure more slowly • NPV for FMP~TA is 12% higher
Harvest & Habitat Model Project • Topics for Today • Final Report Presentation • Project overview • Model strengths and limitations • Comparison of alternatives • Questions analyzed • Level of confidence • Where to from here?
Questions Analyzed 3 North Coast Districts Combined FMP~HCP: Complex Stand Structure Analysis • What is the impact on harvest volume with different complex structure targets - 40%, 50%, or 60%? • Key Findings • There is a trade-off between achievement of harvest volume and attainment of complex stand structure: • Higher targets for complex structure yield lower harvest volumes • Lower targets for complex structure yield higher harvest volumes
Questions Analyzed 3 North Coast Districts Combined FMP~HCP: Volume Flow Analysis
Questions Analyzed 3 North Coast Districts Combined FMP~HCP: Volume Flow Analysis • Can more volume be harvested in the first two decades without falling below a sustainable level? • Key Findings • Total harvest volume in first decade could be increased by 15% without falling below baseline levels • Districts have not verified if this can be implemented on the ground
Questions Analyzed 3 North Coast Districts Combined FMP~HCP: Volume Flow Analysis Astoria Forest Grove
Questions Analyzed 3 North Coast Districts Combined FMP~HCP: Volume Flow Analysis • Tillamook • Initial high volume is dependent on greater productivity of future stands. More stands clearcut early, yield a greater total harvest volume over 150 years
Questions Analyzed 3 North Coast Districts Combined FMP~HCP: Salmon Anchor Habitat Analysis • What is the impact on harvest volume from 10-Year SAH strategies? • Key Findings • 10-year SAH strategies result in less than 0.5% decrease in harvest volume in first decade, and less than 0.1% decrease over 150 years
QuestionsAnalyzed 3 North Coast Districts Combined FMP~HCP: Landscape Design Analysis • What is the impact on harvest volume when using the mapped Desired Future Condition-Complex areas? • Note: Limitations in strata-based inventory prevent high confidence in analysis - more analysis is planned • Key Findings • Locating most of the complex structure inside mapped DFC: • Reduced harvest volume • Delayed achieving complex structure goals for 50 years • DFC Goal “off” – Complex patch sizes & frequencies resembled landscape design descriptions in FMP
QuestionsAnalyzed 3 North Coast Districts Combined FMP~TA: No Complex Structure Goal Analysis What is the impact on harvest volume and habitat if there is no specific goal for complex structure? • Key Findings • Higher harvest volume is achieved in first decade and over 150 years (9%) • Nearly 30% complex structure was still achieved in 150 years • 28% fewer owl circles and 45% fewer marbled murrelet acres were found
Harvest & Habitat Model Project • Topics for Today • Final Report Presentation • Project overview • Model strengths and limitations • Comparison of alternatives • Questions analyzed • Level of confidence • Where to from here?
Level of Confidence Model Solution Reviews Description • Districts reviewed model solutions for 4 periods (20 years) • Focused on implementation in first 2 periods (10 years) • Verified input data and model rules • Reviewed spatial locations and harvest prescriptions for ground implementation • Identified implementation issues
Level of Confidence Model Solution Reviews • Key Findings • FMP~HCP (50% complex structure goal; even flow) • Results consistent with the FMP, HCP strategies and applicable policies that could be modeled • Confidence in implementing first-decade harvest volume was high • Long-term harvest volumes are sustainable • Need flexibility in the mix of harvest acres (clearcut vs. thinning) to mitigate short-term operational issues
Level of Confidence Model Solution Reviews Key Findings • FMP~HCP and FMP~TA • Low confidence in exact location of first-decade harvest units. Note: Models were not intended for operational purposes • FMP~TA • More analysis needed to understand impact of Take Avoidance strategies on southern districts • Districts have concerns regarding TA assumptions • Wood Emphasis & Reserve-Based • Verified spatial data and assumptions, not implementation