Download
1 / 11
110 likes | 112 Views
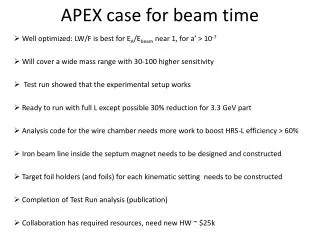
Beam profile vs time. Analyzed Vx vs Vy distributions vs time for Run 72 (13:26:02 – 28:25) Run 73 (13:36:10 – 13:37:30) Run 74 (43:12 – 44:21) Binned distributions with the same Vernier scan location No Z vertex cuts Cut on Vr < 2. Rosi Reed rjreed@ucdavis.edu 6/9/08.

E N D
Beam profile vs time • Analyzed Vx vs Vy distributions vs time for • Run 72 (13:26:02 – 28:25) • Run 73 (13:36:10 – 13:37:30) • Run 74 (43:12 – 44:21) • Binned distributions with the same Vernier scan location • No Z vertex cuts • Cut on Vr < 2 Rosi Reed rjreed@ucdavis.edu 6/9/08
Gaussian Multiplication • Beam is gaussian in shape • Distribution of collisions in xy space is equal to the beam distributions multiplied by each other • Also gaussian in shape
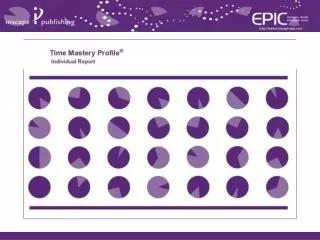
Beam profile vs time Summary # Beam-Beam Events Calculated from Vx vs Vy distributions
Beam Sigmas calculated from formula on pg 3 Error reflect statistical error only Sigma X = 1.75 mm +/- .20 Sigma Y = 2.40 mm +/- .15 If our assumptions are correct, these distributions should be flat
Horizontal Vernier Scan Slope should be +/- 0.5 if our assumptions were correct
Vertical Vernier Scan Slope should be +/- 0.5 if our assumptions were correct
Some comments • I noticed that as the good event rate went down, the ratio of good events to beam pipe events went down • I would like to quantify this next week • No events with a vertex in Run 72 between 13:23:29 and 26:02 • I have not looked at what happened in Run 73 between ~13:30 and 35 • We conclude that the widths of the beams are • Sigma X = 1.75 mm +/- .20 • Sigma Y = 2.40 mm +/- .15