Download
1 / 258
2.58k likes | 2.66k Views
UNECE Workshop on Short-Term Economic Statistics (STS) and Seasonal Adjustment. Astana, 14 – 17 March 2011. Workshop on Short-Term Statistics (STS) and Seasonal Adjustment Workshop Purpose and Scope. Astana, 14 – 17 March 2011 Petteri Baer, Marketing Manager, Statistics Finland.

E N D
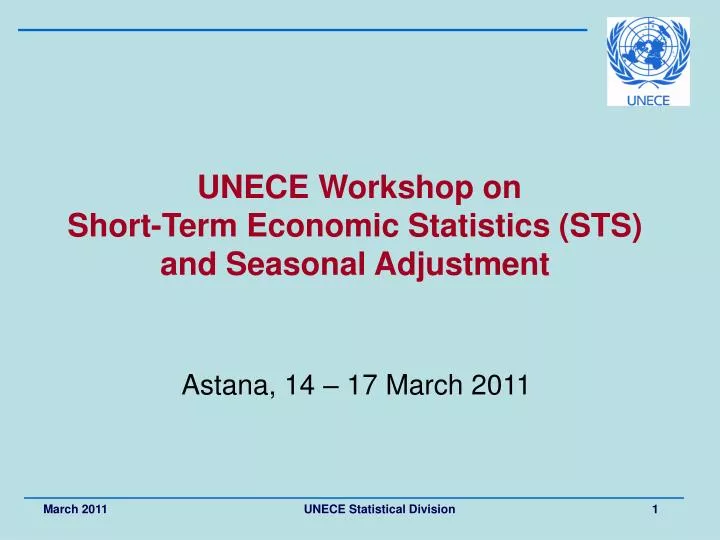
UNECE Workshop on Short-Term Economic Statistics (STS) and Seasonal Adjustment Astana, 14 – 17 March 2011
Workshop on Short-Term Statistics (STS) and Seasonal Adjustment Workshop Purpose and Scope Astana, 14 – 17 March 2011 Petteri Baer, Marketing Manager, Statistics Finland
Capacity Building Program on Challenges in STS The UNECE organizes with the financial support of the World Bank For the Central Asian and other CIS Countries The program consists of training workshops and study visits Builds on the international recommendations Training and exercises will be provided Discusses problems and possible solutions Exchange of experiences Petteri Baer 14 - 17 March 2011 3
Workshop I – STS and Seasonal Adjustment 14-17 March, 2011 (Astana, Kazakhstan) Topics covered: Why are short-term statistics important? Use of multiple data sources Methodology of compilation of STS Dissemination Seasonal adjustment in practice Exercises on seasonal adjustment Participants in this Workshop to participate in the next workshop on seasonal adjustment Petteri Baer 14 - 17 March 2011 4
Workshop II – Challenges in Consumer Price Indices 2011 (Istanbul, Turkey) Topics covered: Calculation of elementary and higher-level indices Coverage of goods and services Treatment of missing prices and their replacements Seasonal items Adjustment for quality changes Will be based on the international Consumer Price Indices Manual Petteri Baer 14 - 17 March 2011 5
Workshop III – Implementation of the 2008 SNA 2011 (Kiev, Ukraine) Topics covered: Implementation issues of the 2008 SNA Discussion of the problematic areas and priority setting Support countries to establish implementation plans Development needs of both national accounts and the related primary statistics Building of networks of experts in SNA and NA Petteri Baer 14 - 17 March 2011 6
Workshop IV – Training in Seasonal Adjustment 2012 (Istanbul, Turkey) Topics covered: Tackle the methodological and practical issues of seasonal adjustment Seasonal adjustment of problematic time series Analyses of the quality of seasonal adjustment Discuss countries’ experiences and problems Petteri Baer 14 - 17 March 2011 7
Agenda for Monday, 14 March 2011 Session 1 Workshop Introduction Welcome Workshop Purpose and Scope Challenges and Problems in the area of STS Session 2 The Aim of STS – User view and Current Developments General recommendations on STS Why STS matters? User view on STS Petteri Baer 14 - 17 March 2011 8
Agenda for Tuesday, 15 March 2011 Session 3 STS Production Methodology STS compilation with multiple data sources Case studies from countries Session 4 An Introduction to Seasonality and Seasonal Adjustment Components of time series, seasonality and preconditions for seasonal adjustment Seasonal adjustment as a process 1. Exercise:Getting started Petteri Baer 14 - 17 March 2011 9
Agenda for Wednesday, 16 March 2011 Session 5 Seasonal Adjustment Practice Why seasonally adjust and how? Issues on seasonal adjustment in the EECCA countries Round table: Current state of seasonal adjustment Session 6 Pre-treatment of Time Series Pre-treatment practice for seasonal adjustment including calendar adjustment 2. Exercise: Examples of graphical analysis, outlier detection and the effect of calendar adjustment Petteri Baer 14 - 17 March 2011 10
Agenda for Thursday, 17 March 2011 Session 7 Performing Seasonal Adjustment Model selection, seasonal adjustment and analyzing results 3. Exercise: Step-by-step seasonal adjustment Session 8 Going forward with seasonal adjustment Disseminating statistical information on economic development How to release seasonally adjusted data Towards the next workshop & closing Petteri Baer 14 - 17 March 2011 11
Participants’ expectations Gain theoretical knowledge and practical skills To carry out seasonal adjustment To start providing users with seasonally adjusted data To get training and methodological materials Exchange experiences with other countries on seasonal adjustment Hear about international recommendations on STS and SA Participant Presentation Round! Petteri Baer 14 - 17 March 2011 12
UNECE Workshop on Short-Term Statistics (STS) and Seasonal Adjustment 14 – 17 March 2011, Astana, Kazakhstan Challenges & Problems of Short-Term Statistics (STS) Based on the UNECE paper on Short-Term Economic Statistics in the CIS and Western Balkans Carsten Boldsen Hansen Economic Statistics Section, UNECE
Agenda • Introduction • Availability of STS • Publication policy • Data collection and compilation of time series • Seasonal adjustment • Conclusions
Introduction • A survey on seasonal adjustment in 2008 • Challenges with STS were analyzed in 2007 and 2009 via web sites of NSOs on: • Consumer price index • Producer price index • Producer price index for services • Industrial production index • Retail trade turnover • Turnover of services • Volume of services production • Wages and salaries
Introduction Countries included in the assessment: Albania Armenia Azerbaijan Belarus Bosnia and Herzegovina Georgia Kazakhstan Kyrgyzstan Republic of Moldova • Montenegro • Russian Federation • Serbia • Tajikistan • The former Yugoslav Republic of Macedonia • Turkmenistan • Uzbekistan • Ukraine
Introduction What constitutes international comparability in STS? • Coverage • Classifications • Methodological and computational practices • Provision of fixed based and/or discrete time series • Provision of long coherent time series • Provision of seasonal adjusted series • Dissemination of documentation
Availability of Time Series Availability of time series with more than six observations
Availability of STS on Services • Share of services (incl. trade) in GDP: • 52% 1996 -> 57% 2008 (in the EECCA countries) • Lack of data for services • Problems for estimating GDP • 8/17 countries publish wages and salaries • Output indicators rarely produced • 7 countries publish turnover or volume of services • Indicators do not cover the whole service sector • Indicators limited to transport, hotels and restaurants
Availability Availability of short-term indicators for services (2009)
Publication Policy Issues • Almost all countries publish advance release calendars • A huge step forward in just a few years • Most countries archive releases to websites • Time series not easily accessible • Few countries have a published revision policy • Metadata have been improved • Timeliness of releases is often very good
Timeliness The average timeliness of STS indicators
Publication of Metadata • 15 of 17 surveyed countries provide some methodological information in English • Countries subscribing to IMF’s SDDS or GDDS have more comprehensive set of metadata • For statistics not included in SDDS/GDDS • Very little data for retail trade and services • Many details regarding production methods not available in English
Publication Methodology • Revisions are a necessary feature of STS • Data are rarely published in time series format • Instead data for a few months is published • Seasonally adjusted data can only be published as long time series • Only half of the countries publish indices with a fixed reference period • Change from previous period should only be calculated from seasonally adjusted data!
Methodology and Comparability Production of STS according to international standards (2009)
Data Collection Methodology • Many have cut-off samples or totals • Over sampling for some countries and indicators? • Some use registers to reduce sample sizes and increase efficiency • Register data requires substantial IT resources and implementation of new production methods • NSOs may have difficulties in accessing registers? • May provide a solution for developing new statistics?
Compilation Methodology • Good knowledge of international standards exists • Significant methodological differences exist: • price indices, retail trade turnover, wages and salaries • Some incoherences in definitions • Definitions of turnover, wages and salaries • Treatment of VAT, subsidies and delivery costs • Need to standardize definitions also in the EU • Almost all countries use internationally comparable classifications for economic activities (ISIC/NACE)
Time Series Methodology Production of cumulative data • Suitable for national use only • Summarizes development during the current year • When data are available for April -> information is provided from January to April • Length of the reference period changes with each release(Jan-Feb > Jan-Mar > Jan-Apr…) • Cumulative data are usually only additional information, not the only type of data • A huge step forward: done by a majority of countries
Comparison of Series – Cumulative Data Industrial Production and Production of Electricity in Belarus Not easy to say which industry is doing better – only the change from previous year visible
Comparison of Series – Monthly Data Industrial Production and Production of Electricity in Belarus Seasonality interferes in comparing monthly data – seasonal adjustment needed
Time Series Methodology Problems with cumulative data • International comparison and analysis not possible • Slow identification of turning points • Change from the previous period in seasonally adjusted data provides faster indications of turning points • User cannot derive a correct monthly time series • Revisions to the earlier periods cannot be matched to the correct periods of time • Time series from cumulative data have incorrect seasonality
From Cumulative to Monthly Cumulative Industrial Production Data (estimates of monthly values)
Time Series Methodology • Fixed base indices and/or absolute values for discrete periods are recommended • Time series to be linked or calculated back when base year is changed • Not to shorten the series or to leave breaks (the series should not start from its b.y.) • Previous periods need to be revised to come up with reliable time series • Currently 10 countries publish time series of more than 24 observations
Where is the Economy Going? Frequent changes of base year without links or backcalculation
Seasonal Adjustment • SA data calculated by 11/17 countries • Need for training, materials/guidelines and support on methodological and practical issues • Expansion of number and length of seasonally adjusted series • More metadata on SA needed for the users • Development of release practices of SA • Standardization of compilation and release practices would enhance quality of SA
Conclusions of the Assessment • Need for longer time series • Historical time series to be build and maintained • Backcalculation or linking in base year changes • Improve international comparability • Seasonally adjusted data would enable comparison • More comparable information on the service sector • Review data collection techniques • Introduce sampling (and allow revisions) • Use administrative sources • Publication policy • New release practices (SA, time series, revisions) • More detailed metadata
UNECE Workshop on Short-Term Statistics (STS) and Seasonal Adjustment 14 – 17 March 2011, Astana, Kazakhstan General Recommendations on STS Carsten Boldsen Hansen Economic Statistics Section, UNECE
Overview • General guidelines and quality • Sources for methodology guidelines • Response burden • STS vs. SBS • Time series • Release Practices • Metadata • User consultation
“The use by statistical agencies in each country of international concepts, classifications and methods promotes the consistency and efficiency of statistical systems at all official levels.” The ninth principle of The Fundamental Principles of Official Statistics in the Region of the Economic Commission for Europe, UNECE
General Guidelines • The Fundamental Principles of Official Statistics (UN)http://unstats.un.org/unsd/dnss/gp/fundprinciples.aspx • Quality of Statistics • Data Quality Assessment Framework (IMF)http://www.imf.org/external/np/sta/dsbb/2003/eng/dqaf.htm • ESS quality framework (EC)http://epp.eurostat.ec.europa.eu/portal/page/portal/quality/introduction • OECD quality framework (OECD)http://www.oecd.org/document/43/0,3343,en_2649_33715_21571947_1_1_1_1,00.html • Handbook of Statistical Organization, The Operation and Organization of a Statistical Agency, 2003 http://unstats.un.org/unsd/dnss/hb/default.aspx
The Fundamental Principles • indispensable for a democratic society • statistical agencies decide methods and procedures • present data according to scientific standards • comment on erroneous interpretation • statistical agencies choose the data sources with regard to quality, timeliness, costs and burden
The Fundamental Principles • strictly confidentiality of individual data and use exclusively for statistical purposes • statistical laws, regulations and measures to be made public • coordination among statistical agencies within countries • use of international concepts, classifications and methods • bilateral and multilateral cooperation
Respondent Burden • Minimizing respondent burden should be an important objective vs. cut-off sampling • Coordination of data collections would help reducing response burden and to divide it more evenly among respondents • Existing sources of information should be used to the largest extent possible • Administrative registers • Commercial datasets • Data collected by other organizations
Coherence = Degree to which data is logically connected and mutually consistent • Coherence within a data set • Coherence across data sets • common concepts, definitions, valuation principles, classifications and co-operation • Coherence over time • Coherence across countries • Extent to which the recommendations have been adopted • Link to national accounts important
STS vs Structural Statistics (SBS) STS = measures economic developments SBS = a snapshot describing structure & detail • STS and SBS have different data sources, definitions, statistical methods, timing and coverage (fiscal/calendar) • Treatment of changes in the population • SBS: the population in the reference year as it is • STS: makes different time periods comparable (by correcting for mergers and splits etc) • Further improvement of coherence needed!
List of Methodology Guidelines • Methodology of Short-Term Business Statistics (EC), 2006http://ec.europa.eu/eurostat/ramon/statmanuals/files/KS-BG-06-001-EN.pdf • International Recommendations for the Index of Industrial Production (UN), 2010http://unstats.un.org/unsd/statcom/doc10/BG-IndustrialStats.pdf • Use of Administrative Sources for Business Statistics Purposes(EC), 1999 http://ec.europa.eu/eurostat/ramon/statmanuals/files/CA-24-99-897-__-N-EN.pdf • International Recommendations for Distributive Trade Statistics (UN), 2009http://ec.europa.eu/eurostat/ramon/statmanuals/files/Inter_Rec_for_Distribut_Trade_Stat.pdf • Methodological guide for Producer Price Indices for Services, (EC) 2005 http://ec.europa.eu/eurostat/ramon/statmanuals/files/KS-BG-06-003-EN.pdf • Evolution of Service Statistics, proceedings of a seminar, (EC) 2002 http://ec.europa.eu/eurostat/ramon/statmanuals/files/KS-BG-02-001-__-N-EN.pdf • Consumer Price Index Manual, Theory and Practice, 2004 (ILO) http://www.ilo.org/public/english/bureau/stat/guides/cpi/index.htm • Practical Guide to Producing Consumer Price Indices, 2009 (UNECE/ILO)http://www.unece.org/stats/publications/Practical_Guide_to_Producing_CPI.pdf • Producer Price Index Manual, Theory and Practice, 2004 (IMF) http://www.imf.org/external/np/sta/tegppi/index.htm • Export and Import Price Manual, 2008 (IMF)http://www.imf.org/external/np/sta/tegeipi/index.htm
Time Series Recommendations • Fixed base indices and/or absolute values for discrete periods to be provided • New series should be linked to the old series to produce continuous series • Cumulative statistics should be published only as additional information • If seasonality influences the indicator, seasonally adjusted and trend series to be published • Reference period should be a year and be updated when the weights are updated
Importance of Long Time Series (1) • Long and consistent time series important for • International comparison • Analysis • Appraisal of business cycles • Current practices of countries vary significantly • Currently no international standards on: • Length of time series • Methods for backcasting • Implementing changes of classifications
Importance of Long Time Series (2) • STS regulation (EC) requires time series from 2000, Eurostat recommends much longer series • Methodology of Short-Term Business Statistics: “To carry out statistical analysis such as seasonal adjustment it is generally considered necessary to have observations for a minimum of 5 years… …for example, in the search for turning points it is important to be able to have data available for several complete cycles.”