Download
1 / 26
260 likes | 421 Views
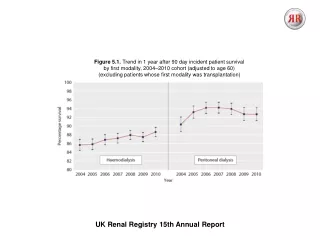
Survival after graft failure Dr Lynsey Webb Registrar UK Renal Registry. UK Renal Registry 2011 Annual Audit Meeting. Overview. Background Survival after transplant failure (UK) Defining a proxy group European analyses Future work. Background. In 2009:

E N D
Survival after graft failureDr Lynsey WebbRegistrarUK Renal Registry UK Renal Registry2011 Annual Audit Meeting
Overview Background Survival after transplant failure (UK) Defining a proxy group European analyses Future work
Background • In 2009: • 23,284 prevalent renal transplant patients • 2.9% experienced graft failure (excluding death as cause of graft loss) • Evidence (mostly North American) that kidney transplant loss associated with significant mortality and morbidity • Why is this important? • Growing transplant population • Young patients • Limited guidelines/ evidence for best practice • Some deaths may be preventable • Quality of life • Financial implications
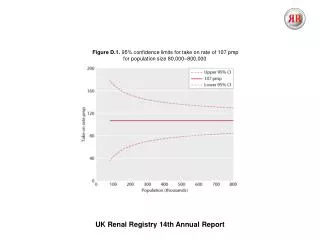
Survival analyses UKRR and NHSBT data Cases = Patients starting dialysis after 1st transplant failure (>90 days function) 01/01/2000 - 31/12/2008 Controls = Patients starting RRT on dialysis 01/01/2000 - 31/12/2008, and wait-listed for transplantation within 2 years Followed to death, or loss to follow up, or 31/12/2010 Censored if transplanted Exclusions: <18 yrs, missing primary renal diagnosis Hazard ratios (case/control) for specific time periods calculated. Adjusted for age, gender, DM, ethnicity and modality
Final cohort Controls Cases UK incident adult RRT patients (1st Jan 2000 - 31st Dec 2008) in UK (n= 46,793) UK adult patients with failure of 1st transplant (1st Jan 2000 – 31st Dec 2008) (n=3,568) Pre-emptive transplants (n=1,645) Pre-emptive re-transplants (n=93) Not listed (n=31,863) 1st transplant <90days duration (n=416) Listed >2 years from RRT start (n=1,543) Controls included in analysis (n= 11,742) Cases included in analysis (n=3,059)
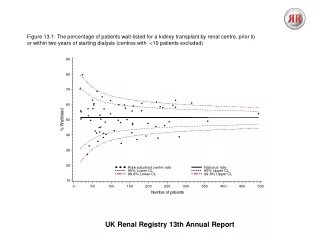
Re wait-listing analysis Of the 3,059 cases, 1,610 were listed for repeat transplantation within 2 yrs
Discussion As would be predicted the greatest risk of death is in the first few weeks following transplant failure but persists until at least 5 years post transplant failure Even if only patients listed for further transplantation (i.e. fitter cases) are considered, an excess mortality risk is seen Limitations: choice of control group, lack of comorbidity data, data capture issues
Background Evolved from plans to undertake a European study ERA-EDTA registry doesn’t normally collect wait-listing data Is it possible (from the data available) to design a “proxy” cohort of patients fit for transplantation? • Preliminary analyses using UK data • Who would be likely to be fit for transplantation? • <50 years old • Non-diabetics
Cases vs. proxy controls (1) 01/01/2000-31/12/2008 Cases = as before, limiting to patients <50 years, non-diabetic Controls = incident dialysis patients <50 years, non-diabetic HR (Case/control) calculated Adjusted for age, gender, ethnicity and modality at start
Cases vs. proxy controls (2) Why are the results so different?
Cases vs. proxy controls (3) • UK wait-listing data used to split proxy group into true and proxy controls
KM survival Survival function True controls Cases Proxy controls Days post dialysis start
Discussion Very hard to define a proxy group Higher proportion of missing data in non-listed proxy controls (previous UKRR work has shown missing data is associated with poorer outcomes) Accurate clinical reasoning – physicians do well at selecting patients suitable for transplants Local-level audit to generate some ideas
European analyses • ERA-EDTA wait-listing data (1998-2005) for: • Norway • Netherlands • Austria • Scotland • Group A • >18yrs old • Starting dialysis after failure of 1st transplant (>90days function) • 01/01/1998-31/12/2003 • Group B • Incident dialysis patients >18yrs commencing dialysis • Wait-listed pre or within 2 yrs of RRT start • Censoring: • Transplantation/re-transplantation • Lost to follow-up • End of study 31/12/2008
KM survival (adjusted) Survival function UK (E&W) Cases (Group A) Controls (Group B) Days
Discussion • There appears to be significant variation in outcomes after graft failure between countries • Access to transplantation • Transplantation practices • Survival on dialysis • Prevalence of comorbidities (e.g. High DM rate in Austria)
Future work • Questionnaire examining centre-level practices • Service provision and staffing • Service design • Research and audit • IT facilities • Explore cause of death data and compare with MRIS death certificate information • Funding for a case-control study
Acknowledgements • Many thanks to: • Supervisors (C. Tomson, Y. Ben-Shlomo) • Anna Casula (UKRR statistician) • UKRR transplant sub-group • UK renal centres and patients • Scottish Renal Registry • Data and systems staff (UKRR) • NHS Blood and Transplant • ERA-EDTA and other participating registries