Download
1 / 27
280 likes | 390 Views
X workshop on Quantitative Finance Politecnico di Milano, 29-30.1.2009. Risk Indicators in the equity market. giorgio.consigli@unibg.it Joint work with L. MacLean, Y. Zhao and W.T. Ziemba. Financial instability The US equity market The asset pricing model Parameter estimation

E N D
X workshop on Quantitative Finance Politecnico di Milano, 29-30.1.2009 Risk Indicators in the equity market giorgio.consigli@unibg.it Joint work with L. MacLean, Y. Zhao and W.T. Ziemba
Financial instability • The US equity market • The asset pricing model • Parameter estimation • Market evidence • Conclusions and future research
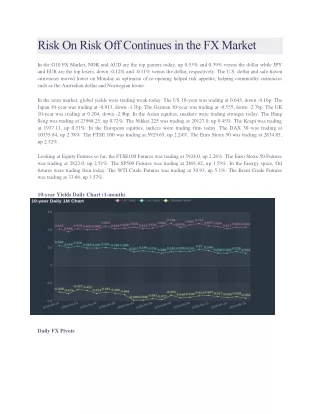
1. Financial instability • In 1996 FED Chairman Alan Greenspan postulated the long term tendency of stock market yields to fluctutate around the 10 year Treasury rate. • Persistent divergence from this underlying process was then to be intepreted as a signal of either over or undervaluation of the equity market. • This idea translates into an extremely practical and easy relative value principle for investment decisions at strategic level • The presence of a bubble can in this setting be detected by a departure of the market index from its theoretical value determined, given current earning expectation, by the 10 year rate.
Irrational exuberance • Greenspan speech came after the 1987 WS crisis and shortly before the 1997 crisis and the 2000 dot.com crisis. • At the end of 1998, a widespread instability affected the Hedge fund industry, due to speculative international strategies across equity and bond markets. • A speculative bubble also drove the surge and fall of far-east markets resulting in the early 90’s series of crises and the 1995 crisis in Japan. • The list might continue and motivates this work, in which we propose a stochastic model for equity and bond returns, that under certain conditions is able to capture a growing, yet unexpressed source of instability
Irrational exuberance U(t)-r(t) U(t)-r(t)
The implied volatility index (VIX, CBOT) • Since Jan 1990, the CBOT quotes daily estimates of an aggregate measure of implied volatility om ATM 30 day options on S&P500. • The index reflects agents expectations on forward (forthcoming) market movements and provides a gap measure between historical and forward equity returns • According to the structural approach to credit risk, implied volatility is also a key variable to assess the credit cycle and provides a direct signal of market uncertainty over future corporate earnings • We propose in the model this additional risk factor as driver, warning signal, of forthcoming market instability
Instability source • We build on these ideas and propose an approach to risk control relying on a market model with endogenous instability factors. • We focus primarily on the equity market. Bonds and cash complete the market model • Price movements are defined by GBM for bonds and GBM plus a marked point process for stocks • We wish to link the behaviour of the point process to the introduced instability factors
2. The asset pricing model • We consider a market including a cash account, the S&P500 index and the 10 year Treasury note. • The stock and bond prices are random processes defined in an appropriate probability space representing the uncertain market dynamics. • The bond-stock yield differential and the VIX process may determine a departure of market values from a theoretical value. • We use the following notation:
Asset pricing • The dynamics of price movements are defined by a Wiener process for bonds and a Cox process for stocks. Let • We capture the equity and bond correlation and the dependence of the equity process on the risk factors directly introducing a model with random drifts • We assume that volatilies remain constant over time while:
Asset pricing • The risk process dynamics for market instability are captured by dR: • We separate positive from negative shocks and employ a threshold regression method to estimate the significance of each risk factor • Market stress is defined through a discordance measure
Asset pricing (ctd) • Shock intensities are assumed to depend monotonically on the stress generated by the risk factors • An increasing intensity implies a Weibull process so that follows a Weibull distribution with density for i=1,2 (up and down shocks respectively)
Asset pricing (ctd) • The distinguishing feature of the asset pricing model is the risk process • The parameters of the market processes are • It is assumed that the risk factors characterize market stress, which in turn affects shocks to equity prices through the model parameters
3. Parameters estimation • The estimation methodology employs a threshold regression methodology. • A shock sequence is initially assumed relying on excesses beyond a pair of positive and negative threshold • Given the shock sequence, conditional ML is performed • Then the shock sequence is updated • For every shock sequence the dependence on the stress factors is directly evaluated • The procedure stops when the loglikelihood function is maximised for the given shock sequence
distributions (ctd) • Consider • The conditional distribution of the increments given the jump sequence is bivariate normal with density:
parameter estimation (ctd) • Again given the jump sequence it is straightforward to estimate • The likelihood for given the jump sequence and actual shock times:
parameters estimation • The method proceeds as follows: 1. Set stress weights and calculate stress values 2. Calculate the empirical distributions for positive and negative shocks over the sample period 3. Specify a grid size, an initial tail area and a step, identify positive and negative shock times 4. Calculate for the given shock sequence the cond ML coefficients • Back to 3 until the best shock sequence is identified • The diffusion and jum size parameters are estimated by maximizing the loglikelihood • The Weibull parameters are estimated from
4. Computational evidence • We present now estimation results and test two market hypotheses underlying the model • Parameter estimation is based on the described ML estimation conditioning on ar given jump sequence. • Starting from an initial 1% excess with steps |0.05%| we span the tail area Diffusion parameters Risk process parameters
Results • Given these estimates we can perform a forecast experiment over the entire sample 1990-2007 • Starting from January 1, 1990, the predicted/expected increments were calculated over the subsequent time peirod as
Results • We have simulated out of sample 2000 daily trajectories for the estimated Cox process with shock magnitude and frequency explicitly dependent on the BSYR over the 20 years. S&P500 (blue)
computational evidence • In most cases the fits are good. The weights which gave the best fit, w=0 (full VIX) are the same for positive and negative shocks • In many time points the BSYD is closer to actual price dynamics • The best convex combination is given by w=0.75
Results – Tests on market hypotheses over the entrie sample Risk premium • We estimate the S&P implicit risk premium by testing the FED equilibrium condition: the null hypothesis is rejected at the 95% with a difference of 6,78% interpreted as a constant risk premium in the market Bubble • The shock driver can very well be associated with risk sources other than the two here considered • The logikelihood ratio test for the cox process is significant on the 99% confidence interval: • 2*(A.loglikelihood – B.loglikelihood) = 124.19 > 6.6349, X^2(1) with 99% confidence
Conclusions and further work • The presented market model integrates common practitioners beliefs within a satisfactory analytical framework • The Cox process instantiates an endogenous source of instability and a novel estimation procedure has been implemented with the reported results • We will then extend the analysis to other markets (Nasdaq, Eurostoxx, etc.) • The solution of the associated stochastic control problem with alternative risk-return payoffs will follow
References • Consigli, G., 2002. Tail estimation and mean-variance portfolio selection in markets subject to financial instability. Journal of Banking and Finance26:7, 1355-1382 • Koivu, M., Pennanen, T., Ziemba, W.T., 2005, Cointegration of the Fed model, Finance Research Letters2, 248-259. • K.Berge, G.Consigli and W.T.Ziemba (2008). The Predictive Ability of the bond-stock earnings yield differential in relation to the Equity risk premium, The Journal of Portfolio Management 34.3, 63—80 • G.Consigli, L.M.MacLean, Y. Zhao and W.T.Ziemba (2009). The Bond-Stock Yield Differential as a Risk Indicator in Financial markets. To appear in The Journal of Risk 11(3) • L.M.MacLean, Y.Zhao, G.Consigli, W.T.Ziemba (2008). Estimating parameters in a pricing model with state dependent shocks. Handbook of Financial Engineering, P.M. Pardalos, M.Doumpos and C. Zopounidis (Eds), Springer-Verlag,