Download

1 / 20
200 likes | 224 Views
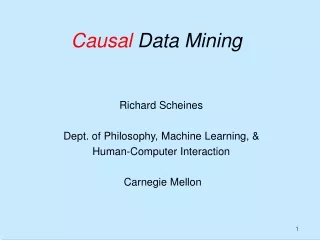
I think that: A B C (hypothesis). D-separation and causal exploration of data. Confirmatory tests : you have a causal hypothesis and you want to see if the empirical data agree with it. Do the data agree with my hypothesis?.

E N D
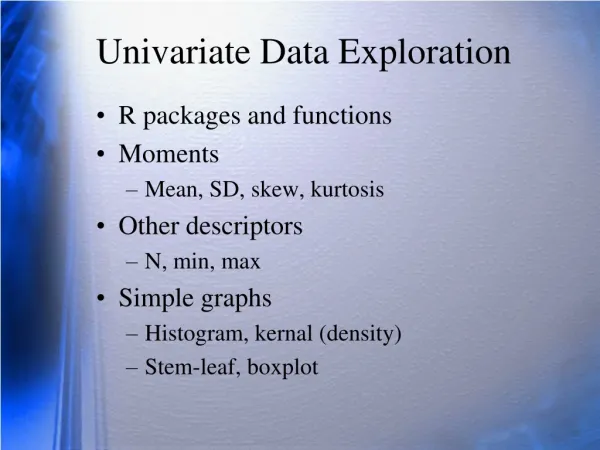
I think that: A B C (hypothesis) D-separation and causal exploration of data Confirmatory tests: you have a causal hypothesis and you want to see if the empirical data agree with it. Do the data agree with my hypothesis? Exploratory studies: you have empirical data and you want to know what sorts of causal models are consistent with it. My data has this pattern of correlation within it What causal processes could have generated this pattern?
“3-D” causal process “2-D” correlational shadow B & C independent given A A & D independent given B & C B & D independent given D and so on... A B C D E Hypothesis generation
D-separation and causal exploration of data Besides the notion of d-separation, we need one other notion: faithfulness of data to a causal graph Is there one Bighorn Sheep in this picture, or are there two, except that the second is hidden behind the first? Both cases are possible, but the second case requires a very special combination of factors, i.e. that the second animal is positioned so that it gives the illusion of being absent. If the second case happens, then we can say that this is unfaithful to our normal experience.
+10 A A B B -2 +5 C C D-separation and causal exploration of data Unfaithfulness This will only occur when positive and negative values exactly cancel out (very special conditions) like seeing one sheep because the other one is hiding behind the first! Overall effect of A on B: +10 + (-2*5)=0 Because the two paths exactly cancel out, the overall correlation between A and B is zero; i.e. uncorrelated! The joint probability distribution over A,B & C is unfaithful to the graph because it gives the illusion of of independence between A and B contrary to d-separation.
A A B B C D C D E E True process which we can’t see! D-separation and causal exploration of data Obtaining the undirected dependency graph Step 1: create a saturated undirected dependency graph.
A A B B C D C D E E True process which we can’t see! D-separation and causal exploration of data Obtaining the undirected dependency graph Step 2: let the order n (i.e the number) of conditioning variables be zero (i.e. no conditioning variables) - For each unique pair of variables (X,Y) that are still adjacent in the graph…) - For each unique set Q of the n other variables in the graph (in this case none…) Test the data to see if variables X and Y are independent given the conditioning set Q. If X and Y are independent in the data, remove the line between them in the graph
A A B B C D C D E E True process which we can’t see! D-separation and causal exploration of data Obtaining the undirected dependency graph Step 2: let the order n (i.e the number) of conditioning variables be zero (i.e. no conditioning variables) Is A & B independent given no others? No; don’t remove the line Is A & C independent given no others? No; don’t remove the line And so on... Result: we don’t remove any lines at this stage.
A A B B C D C D E E True process which we can’t see! D-separation and causal exploration of data Obtaining the undirected dependency graph Step 3: let the order n (i.e the number) of conditioning variables be one (i.e. one conditioning variable) Is A & B independent give C? No. Is A & B independent given D? E? No. Is A & C independent given B? Yes. Therefore, remove the line between A and C and go to next pair (A,D)
A A B B C D C D E E True process which we can’t see! D-separation and causal exploration of data Obtaining the undirected dependency graph Step 3: let the order n (i.e the number) of conditioning variables be one (i.e. one conditioning variable) Is A & B independent give C? No. Is A & B independent given D? E? No. Is A & C independent given B? Yes. Therefore, remove the line between A and C and go to next pair (A,D) Is A & D independent given B? Yes. Therefore, remove the line between A and D and go to next pair (A,E)
A A B B C D C D E E True process which we can’t see! D-separation and causal exploration of data Obtaining the undirected dependency graph Step 3: let the order n (i.e the number) of conditioning variables be one (i.e. one conditioning variable) Is A & B independent give C? No. Is A & B independent given D? E? No. Is A & C independent given B? Yes. Therefore, remove the line between A and C and go to next pair (A,D) Is A & D independent given B? Yes. Therefore, remove the line between A and D and go to next pair (A,E) And so on for each unique pair of variables and each unique conditioning set.
A A B B C D C D E E True process which we can’t see! D-separation and causal exploration of data Obtaining the undirected dependency graph Step 4: let the order n (i.e the number) of conditioning variables be two (i.e. two conditioning variables) Is A & B independent give any two others? No. Is B & C independent given any two others? No. Is B & D independent given any two others? No. Is B & E independent given any two others? Yes (C & D). Therefore, remove the line between B and E and go to next pair (A,D)
A A B B C D C D E E True process which we can’t see! D-separation and causal exploration of data Obtaining the undirected dependency graph Step 4: let the order n (i.e the number) of conditioning variables be two (i.e. two conditioning variables) Is A & B independent give any two others? No. Is A & E independent given any two others? No. Is B & C independent given any two others? No. Is B & D independent given any two others? No. Is B & E independent given any two others? Yes (C & D). Therefore, remove the line between B and E and go to next pair (A,D)
D-separation and causal exploration of data Obtaining the undirected dependency graph This algorithm is provably correct for any probability distribution, and for any functional relationship between variables, and for both cyclic and acyclic causal structures assuming: 1. Faithfulness; 2. All data are generated by the same causal process; 3. No incorrect statistical decisions have been made when deciding upon statistical independence between variables in the data (i.e. lots of data and tests appropriate to the variables in question) The fewer data you have, the greater the chance of missing small, but real, statistical dependencies (statistical power)
A B C D E latent A A C D C D B B D-separation and causal exploration of data Interpreting the undirected dependency graph If there is a line between two variables in this undirected dependency graph then: 1. There is a direct causal relationship between the two and/or ... 2. There is a latent variable that is a common cause of the two and/or... 3. There is a more complicated type of undirected path between the two (an inducing path)
A C D C D A B E E B C D C D E C D C D E True process which we can’t see! C D E E C D E We’ve learned this! We can’t see this! X Y Z E D-separation and causal exploration of data Orienting the undirected dependency graph Shielded colliders Unshielded collider Unshielded non-colliders Unshielded pattern
In an unshielded collider, C & D will neverbe independent conditional on E plus every possible combination of remaining variables. C D C D C D E E In an unshielded non-collider, C & D must be independent conditional on E plus (possibly) some other combination of remaining variables; this is why the line between C & D was removed in the undirected dependency graph! C D E E D-separation and causal exploration of data Orienting the undirected dependency graph C & D dependent given all ofQ={ E, E+A, E+B, E+A+B} C & D independent given one of Q= { E, E+A, E+B, E+A+B}
D-separation and causal exploration of data Orienting the undirected dependency graph B D E B C E C B D A B D A B C C E D C E D A A A B B B C D C C D D E E E True process which we can’t see! We’ve learned this! We can’t see this!
D-separation and causal exploration of data Orienting the undirected dependency graph A A A B B B C D C C D D E E E True process which we can’t see! We’ve learned this! We can’t see this! Partially-oriented acyclic graph We can’t learn any more by just looking at the data. We can orient the rest of the edges any way we want, so long as we don’t: - create or destroy any unshielded colliders that are found in the partially-oriented graph - create any cycles in the graph. All such graphs are statistically equivalent and we can’t test between them.
D-separation and causal exploration of data Example using the EPA2 program
D-separation and causal exploration of data There are some further algorithms that can sometimes allow us to orient more lines, but they are more complicated and require more specialized patterns. There are also algorithms for oriented cyclic causal processes, but these are even more complicated and require stronger assumptions (linearity of relationships and continuous variables). There are also algorithms for detecting latent variables, but these assume both linearity and normality. • The TETRAD Project: • Causal Models and Statistical Data • http://www.phil.cmu.edu/projects/tetrad/ Causal toolbox: http://callisto.si.usherb.ca:8080/bshipley/