Download

1 / 57
570 likes | 581 Views
This guide provides insights on designing a scalable and flexible data warehouse architecture to meet the future information requirements of the business. It includes tips on convincing business users and the IT department about the benefits of a pilot project, building an enterprise data warehouse, and avoiding proprietary solutions. The guide also covers requirements modeling and considerations for modeling dimensions, as well as concepts like slowly changing dimensions and warehouse keys.

E N D
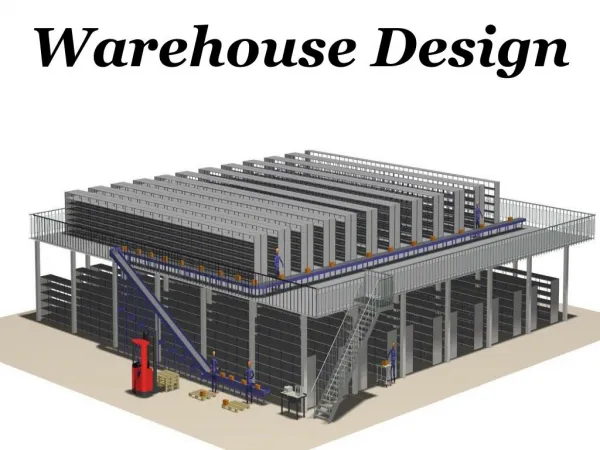
3 Warehouse Design for IQ
Information Framework for the future 1. Choose a Data Warehouse architecture which is scalable, flexible and provides an evolutionary path for Business information requirements. 2. Try to convince the business users and IS department that a Pilot project is a good idea. 3. Building a Enterprise Data Warehouse for the first project is OK, but build it small, try to reduce the number of data sources and minimize historical requirements 4. Don’t cut corners for expediency, keep the faith and build a new Data Warehouse environment which will meet the future Business informational needs of the organization. 5. Don’t Build a proprietary Data Warehouse, it will limit you in the future and cause career limiting observations. 6. Always consider performance of the Data Warehouse at all times.
Requirements modelling • Produce detailed models for the dimensions • resulting multi-dimensional models could be a Star or Snowflake • Must capture details of the structure of the dimensions as well as attributes • Identify candidate measures to be sliced by dimensional attributes
"What is the net sales, in terms of revenue (dollars) and quantities of items sold, by product, by store and by sales region, by day and aggregated over time, by customer and sales areas, over the last 2 weeks?" year quarter month day item Schema of the initial dimensional model Product department Time sub- category Sales category product brand item key week store key store customer customer key city day Sales Area country revenue Sales quantity sold Customer Region Store
Role & purpose of dimensions • Dimensions contain business attributes which will be used as filters of facts and measures and and provide meaning to the measure. • Also used for aggregation paths for Facts • Dimensions are access paths and can contain text, indicators • History is not usually supported by this type of table • Can contain hierarchies sometimes not
How to model a dimension • For each aggregation path: • Create an entity for each aggregation path in the hierarchy • Add keys to identify and link these entities (In hierarchy) • Populate with source attributes specified by business users • If no aggregation path exists: • All attributes must be at a similar grain, otherwise differing grains are aggregation paths
Customer dimension contains Customer rolled up into Sales Areas #1
Customer dimension contains Customer rolled up into Sales Areas #2
Customer dimension contains Customer rolled up into Sales Areas #3
Considerations • Sometimes adding other dimensional hierarchies than those defined by end users can produce good results. Especially low level detail grains. Hard to reengineer if requirements change • In all instances, attempt to create ‘Conformed’ dimensions - ‘A conformed dimension is a dimension that means the same thing with every possible fact table to which it can be joined’ (R Kimball) • Examples: Product, Time, Customer
Modelling product conformed dimensions - Collapsed hierarchies
Modelling Store conformed dimensions - Collapsed hierarchies Store dimension Store Dimension Key Store Sales fact City Country Product key Sales Area Store key Descriptors.... Customer key Properties.... Time key MEASURES
Modelling Time conformed dimensions - Collapsed hierarchies Time dimension Sales fact Time dimension Key Day Product key Month Store key Quarter Customer key Year Time key Week Descriptors.... Properties..... MEASURES Non derivable attributes Derivable attributes
Advance Modelling Concepts • Modelling Slowing changing dimensions • Dimensions change over time, how do we handle these changes • Model optimisation techniques • Design techniques
Warehouse keys • What is a Warehouse key? • It is an integer value that is assigned to each dimensional row instance in the Data Staging area. • ‘All data warehouse keys must be meaningless surrogate keys. You must not use the original production keys’ (Ralph Kimball)
Advantages High performance because of numeric integer value Can accept data from multiple data sources that have different production key structures If production keys are recycled the warehouse key will not be changed Many Front ends cannot use concatenated keys Disadvantages More complex Data Staging because the warehouse key must be assigned A lookup of related Foreign keys must occur to establish the relationship Loading dependencies can occur eg Dimensional rows must be loaded first before Facts can Warehouse keys Always use Warehouse keys, it is a strategic design rule that will pay off in the future as new data sources are found and production keys recycle.
Slowly changing dimensions • Dimensions values change over time, these must be supported by population and loading techniques and are specified by dimensional modellers
Temporal modelling issues • Dimensional attribute changes, eg Customer marital status changes from ‘single’ to ‘married’ etc • Dimensional Hierarchy changes, eg adding an aggregation level within the dimension or deleting an aggregation level etc • Reflecting changed data over time
Key Start D. End D. Flag B. Data 001 01-01 31-12-2999 A XYZ…. 002 01-01 02-01-1998 A XYZ…. 003 01-01 31-12-2999 A XYZ…. 004 01-01 31-12-2999 A XYZ…. 005 01-04 31-12-2999 C XYZ…. 006 01-04 31-12-2999 C XYZ…. Constructive merge NK ABCD EFGH IJKL MNOP Constructive Merge process - Type 2 with end date. DW table rows day number 2 Delta records added to DW Table NK Key Start D. End D. Flag B. Data 001 01-01 31-12-2999 A XYZ ABCD EFGH 002 01-01 02-01-1998 A XYZ…. IJKL 003 Updated End D. rows 31-03-1998 01-01 A XYZ…. MNOP 004 31-03-1998 01-01 A XYZ…. IJKL New Rows added to DW MNOP Note: New rows are added to DW, old row instances for same Natural key value have had their End Date updated to a day before the Start date of the new row instance. Rows 003 has the same NK as inserted row 005, row 004 has the same NK as inserted row 006.
What are State and Event models? Modelling the history of an entity: two base modelling approaches State model Each record represents a history StateO State1 State2 record of the state of the entity, (original valid during a given period of state) time State2 Event model State1 One record represents the initial state of the entity State State State0 All others represent state change1 change2 (original change events state) No initial state record if the entity itself is an event or a transaction
Event Model dimensional entities for which state changes are of interest In principle states can be reconstructed from an event model State model dimensional entities for that state which is prime interest State versus Event models In many cases , state and event models are mixed in a so called hybrid history model
Timestamp approach #1 • Instance timestamp • a timestamp in the form of a single time value which is associated with the history record Entity1 Entity_Identifier InstantTimestamp Attribute1 Attribute2 .... AttributeN
Timestamp approach #2 • Interval timestamping • a timestamp in the form of an interval or a duration which is associated with the history record eg • interval = (BEGIN-TIME, END-TIME), OR (BEGIN-TIME, DURATION) Entity2 Entity3 Entity4 Entity_Identifier Entity_Identifier Entity_Identifier (BeginTime, EndTime) (BeginTime, Duration) DurationTimestamp Attribute1 Attribute1 Attribute1 Attribute2 Attribute2 Attribute2 .... .... .... AttributeM AttributeM AttributeM
Other time domain ideas • A temporal model may contain several timestamps possibly belonging to different time domains • ‘Start date’ are most valuable for end-users • ‘Start date’ can be assigned at extract of source data, ‘End date’ is used when row is obsolete • Other date/s are appropriate in some instances Example of additional Time domains Time Valid Source Capture Apply Time Transaction Time Time Time
Adding Dimension to dimension relationships • Simple one-to-many relationship • These can consist of direct relationship or via a Fact less Fact table when a many-to-many relationship exists • Updating relationship keys can be a useful technique For example (later)
Changing Dimension Example • John Smith • Birthday 30/6/67 • Initial Load on 3/11/97 has DemoID =1 • After Birthday on 7/1/97 DemoID now = 2 • No longer in the 20-29 age range Pre Load Post Load As of 7/1/97 Dimension row for John Smith ‘Demoid’ is updated to 2 by post load process
Accurately Recording History • John Smith • Birthday 30/6/67 • Charge on 28/6/97 has DemoID =1 • Charge on 7/4/97 DemoID now = 2 • No longer in the 20-29 age range • Reflect correct demographics at time of charge
Model enhancements & optimisations • ‘Adding aggregated facts is a technique that aims at optimising data retrieval by adding facts to the model that store measures which are aggregated along one or more dimensions’ • Why? • Optimises performance
Advantages improves performance if atomic detail not required (usually 70 % or queries can be supported by aggregated data) Less group by clauses Disadvantages Greater disk storage time to load and summarise Difficult to aggregate for all BU’s Advantages and disadvantages of aggregated facts Beware of aggregation explosion, very good for predefined query environment
Merging fact tables • Merge Fact tables when ‘compatible (Conformed) dimensions are present • Advantages • Storage savings under certain conditions • Less indexes • simpler for BU • Disadvantages • Grains could change unless very careful
Dimensions Summary • Always attempt to build ‘Conformed’ dimensions • Attributes in the dimensions will be used for selection. Not the Key! • Ensure grains are consistent • Always assign a Warehouse key
Facts Summary • Facts are meaningless without dimensions • No table scans • Are dependent on dimensions for filtering and selection • May not need warehouse key • Ensure grain is lowest as possible. This will facilitate flexibility
Product The ‘Star’ Time department sub- year category Sales quarter category product month day item brand product key week store key customer key store customer customer sales city time key area country revenue Customer sales quantity sold region Store
Levels of DW Information • Core Warehouse Data • Standard Aggregates • Special Aggregates • General Denorms • Multidimensional • Time series • Star Joins • Snowflake • Hypercube
Core Warehouse Data:Atomic Data • Lowest level of detail (Transaction) • Once stored, is never changed • Essential to an enterprise data warehouse • 15-30% of management questions cannot be answered without transaction level data • Huge • Up to Billions of rows • Takes tremendous horsepower to process
Aggregation • Summarization of detail fact tables • No need to read all the detail records if what we’re interested in is Sales by Region • Single most effective tool to control performance • May be lightly or highly summarized • Ten-fold to a thousand-fold improvement in runtime • Reduces total number of CPU cycles • May be created during load process • Needs special “aggregation” dimensions • Break off hierarchy before lowest level of detail
The Information Cube Concept • View in multiple dimensions • Each dimension is composed of attributes • Slice & dice along each of its dimensions City Pairs Time Class of Service 3-Dimensional Cube
Normalized Geography Data Model Geography Entity Hierarchy
Geographic Dimension GeoKey Continent Country Region State/Province County/Area City PostalCode GridReference Denormalized Geography Dimension • Entire Attribute Hierarchy in each Geography Dimension Record • One record for each combination of attribute combinations kept in Legacy Systems
The Information Cube Concept • View in multiple dimensions • Each dimension is composed of attributes • Slice & dice along each of its dimensions City Pairs Time Class of Service 3-Dimensional Cube
Drilling • Drilling down • Increasing the number of records returned • Drilling up • Decreasing the number of records returned • Let’s look at dimension attribute hierarchies to understand how drill up and drill down are dependent on them
One Attribute (Drill Up) Less Detail More Detail Many Attributes (Drill Down) What’s the Purpose of Dimension Attributes? • Controls the level of detail returned in the answer set • The fewer Dimension attributes in a query, the higher level the information returned • Let’s look at dimension attributes in more detail The Information Pyramid
Geography Dimension Attributes Attribute Hierarchy Attributes Region State City….. Boston MA Natick Northeast Quincy City Pairs Windham NH Nashua Salem San Francisco CA Los Angeles West Burbank Portland OR Time Eugene Oregon City Class of Service 3-Dimensional Cube