Download
1 / 33
330 likes | 567 Views
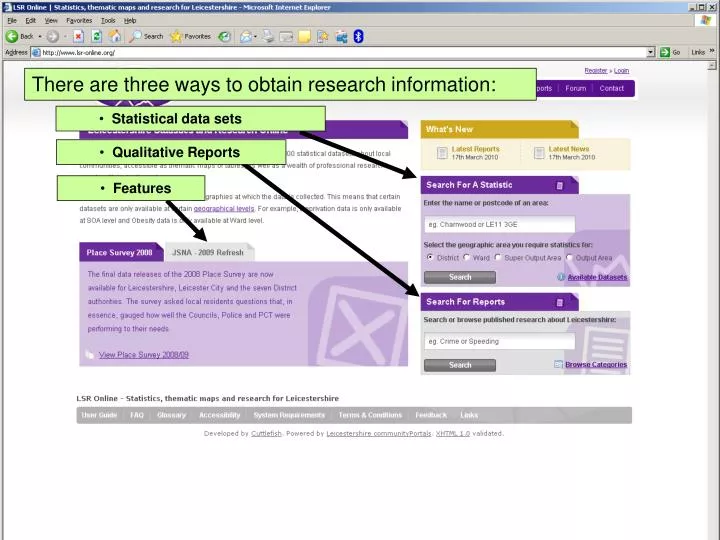
There are three ways to obtain research information:. Statistical data sets. Qualitative Reports. Features. Check what data is held at which level of geography (District, Ward, SOA or OA). Enter the name or postcode of your area of interest. Click the Search button.

E N D
There are three ways to obtain research information: • Statistical data sets • Qualitative Reports • Features
Check what data is held at which level of geography (District, Ward, SOA or OA) Enter the name or postcode of your area of interest. Click the Search button. You must have registered and be ‘logged in’ to view the datasets. Select the level of geography that holds the data you require. • Statistical datasets
If a location name was used, select the appropriate geographic area of interest. (Using a Postcode will miss this step and take you straight to Step 2). We’ll select the SOA ‘Melton Newport East’ to go to Step 2.
Your selected area and level of geography are shown here. (If a postcode is used this always defaults to Output Area, the lowest geography level). This left hand box allows you to select geographies. The level of Geography containing your chosen area will be highlighted. This right hand box will display all available datasets for the geographic level selected.
It is possible to change the level of geography in order to select those datasets for that level. In this example we have changed the geographic level to Ward. We can see that the SOA of ‘Melton Newport East’ is within the Ward ‘Melton Newport’. Ward datasets will now be presented for ‘Melton Newport’.
Alternatively, ‘All’ or ‘None’ will allow selection or de-selection of Data elements. Use the Shift or Ctrl keys to click and select any number of geographies. Navigate the dataset hierarchy tree and select which data elements you require. Alternatively, ‘All’ or ‘None’ will allow selection or de-selection of geographies.
Sort columns by clicking on the headers Here are the required statistics for the selected area Drill down for statistics of smaller geographies, if available. Move up to view statistics for higher geographies
Sort by either name or data columns Zoom in on any one area
Click here to return to the homepage at any time Use the ‘Browse Categories’ to view Reports
Leicestershire Statistics and Research Online c/o County Hall Glenfield Leicester LE3 8RA 0116 305 7341 0116 305 6891 Contact: admin@lsr-online.org