Download
1 / 22
220 likes | 344 Views
«Marine E nvironmental M onitoring M odern G eospatial I nformation S ystem of the Black Sea Countries” «Сучасна геопросторова база даних морського екологічного моніторингу Причорноморських країн». Автори: І.Лоєва., д.географ.наук , професор

E N D
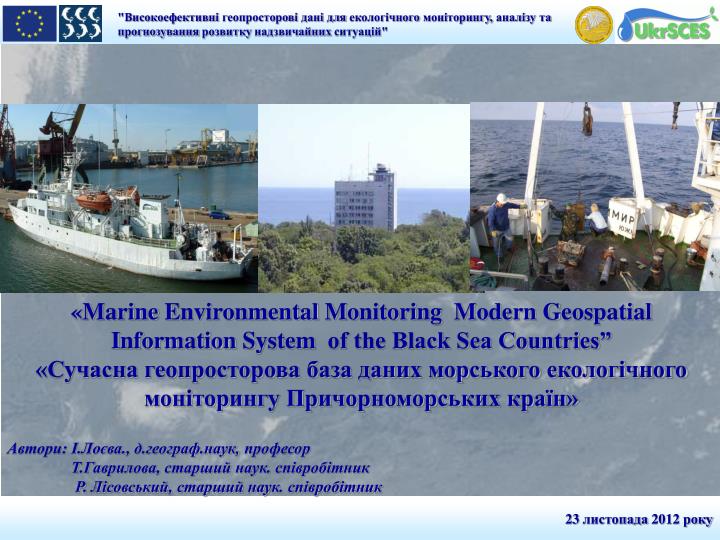
«Marine Environmental Monitoring Modern Geospatial Information System of the Black Sea Countries” «Сучасна геопросторова база даних морського екологічного моніторингу Причорноморських країн» Автори: І.Лоєва., д.географ.наук, професор Т.Гаврилова, старший наук. співробітник Р. Лісовський, старший наук. співробітник
Activities • Basic version of RDB-P developed. All BSC data on pollution monitoring loaded in the database (D1) • Development of tools for manual and automatic upload/download data into/from RDB-P(D2) • Development of web-interface with accessible user functionality (D3) • Operational RDB-P installed at dedicated server and accessible online via GIS-enabled Web interface (D4) • Mirror copy of the RDB-P installed at Client’s server(D5) • Quality Control tools incorporated in the database. QC applied to data stored in the database (D6) Tools for calculation of statistics and indicators incorporated in RDB-P(D7) Tools for calculation of statistics and indicators applied to pollution monitoring data stored in the database.Analysis of variability of eutrophication parameters (trends, spatial distribution) performed.(D8)
Activities • Developed Interactive (web based) Geographic Information System (GIS) for accommodation of cartographic materials and environmental data. • Ensured spatial referencing of data (where appropriate) for integration of the Regional Database with GIS for data mapping and visualization with the help of Map Services. Integration with Google Earth and/or Google Maps is further recommended.
Development of web-interface with accessible user functionality
Enter to Database Depth level
Countries statistic Enter to Database Statistics
Quality Control tools incorporated in the database. QC applied to data stored in the database (D6). Data QC – Static range
Tools for calculation of statistics and indicators applied to pollution monitoring data stored in the database (D8) E-TRIX
Tools for calculation of statistics and indicators applied to pollution monitoring data stored in the database (D8) E-TRIX Result Sample
Tools for calculation of statistics and indicators applied to pollution monitoring data stored in the database (D8) E-TRIX Result Sample
Tools for calculation of statistics and indicators applied to pollution monitoring data stored in the database (D8) Water Quality
Tools for calculation of statistics and indicators applied to pollution monitoring data stored in the database (D8) Water Quality - Result
Environmental sensitivity of the coastal zone to oil pollution 1:50 000 1:200 000
Interactive Map Services of marine and coastal zone nature usage (Portal) Currently, there are 12 interactive mapping systems located at the Portal: • «MAOSIS» • «АTLAS» • «Odessa Agglomeration» • «Sasyk Lake» • «Odes’ka oblast» • «Computer system for analyzing of the environmental effects of technological accidents at the sea aquatoriums» • «Karkinits’ka Gulf» • «Atlas of hydrophysical and hydrochemical parameters of the north-western part of the Black Sea» • «Environmental sensitivity of the coastal zone to oil pollution» • «Nature recreational potential of the coastal zone of Ukraine» • «Ecological network» • «BSIMAP»
Operational RDB-P installed at dedicated server and accessible online via GIS-enabled Web interface (D4) UkrSCES servers area Regional DB-P Dedicated Server *HP DL G7
Software Server Software: • MS WINDOWS 2003 server (licensed) — Operation system; • MS SQL 2000 (licensed) – server DB; GIS software: • ESRI ArcView (licensed) 3.1 –GIS , with additions: ESRI – 3D Analist • ESRI – Spatial Analist; • ESRI SDE (licensed), 9.1 - Spatial databases server; • ESRI IMS (licensed) 9.1 - Cartography subsystem for INTERNET (Internet mapping system), • ESRI ArcEDITOR 9.1 – GIS. • ESRI ArcGIS Desctop Advanced 10.0 • ESRI ArcGIS Server Advanced 10.0
Cooperation with partners Ministry of Ecology and Natural Resources of Ukraine Ministry of Emergency Response of Ukraine The Commission on the Protection of the Black Sea Against Pollution The Helsinki Commission. Baltic Marine Environment Protection Commission Intergovernmental Oceanographic Commission (IOC) International Oceanographic Data and Information Exchange (IODE) Marine Information Service (MARIS) Environmental Systems Research Institute (ESRI) Projects:
Thank you for attention and visit our website: www.sea.gov.ua