Download
1 / 17
180 likes | 348 Views
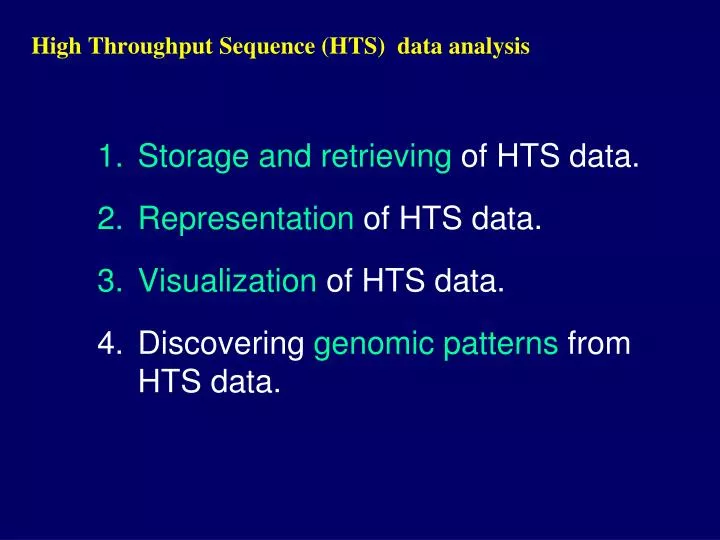
High Throughput Sequence (HTS) data analysis. Storage and retrieving of HTS data. Representation of HTS data. Visualization of HTS data. Discovering genomic patterns from HTS data. First step. Practice: log into a Linux system (such as UFHPC).

E N D
High Throughput Sequence (HTS) data analysis • Storage and retrieving ofHTS data. • Representation of HTS data. • Visualization of HTS data. • Discovering genomic patterns from HTS data.
First step Practice: log into a Linux system (such as UFHPC). • Connect and log into the system with Putty. • Make a directory by typing “mkdiryour_name” • Type “ls” or “ls -l” to verify the folder. • Download data file with “wget –c URL”
Recoding sequence information – sequence file format FASTA format– suitable for single gene or genomic region, pre-genomic era. >Gene_name or accession, (other info) ACTGGGTTTATGACGTGTCATGCATGCAATGTAGCTAGATGCTAGCTAGATGCTAGCTAGATGCTA…. Defined format is necessary for computers to identify and process the information.
Recording sequence and quality information FASTQ format = FASTA + Quality • @HWI-EAS209_0006_FC706VJ:5:58:5894:21141#ATCACG/1 • TTAATTGGTAAATAAATCTCCTAATAGCTTAGATNTTACCTTNNNNNNNNNNTAGTTTCTT • +HWI-EAS209_0006_FC706VJ:5:58:5894:21141#ATCACG/1 • !"#$%&'()*+,-./0123456789:;<=>?@ABCDEFGHIJKLMNOPQabdefghadfda • Two identification lines (@, +) for each sequence. • Identification line format depends on specific sequencing platform. • Quality line using characters representing integer values.
HTS data file • Sequence and quality information are recorded as multi-FASTQ files. • For efficient storage and transmission, they are transformed into SRA (Sequence Read Archives) format. Practice: transform the SRA file to fastq. • “$ fastq-dump.2path_to_sra_file”
Representation of (HTS) data – BED (Browser Extensible Data) file Chrom. Start End name Scor Strand chr210000192 10000217 U0 0 + chr210000227 10000252 U1 0 - chr210000310 10000335 U2 0 + chr310000496 10000521 U1 0 - chr2 10000556 10000581 U2 0 + With the completion of the genome, there is no need to record the base pair identity (if it is the same as the reference genome). Detailed description of genomic data formats: http://genome.ucsc.edu/FAQ/FAQformat.html
HTS data – map to genome • “bwa” or “bowtie” are the two most popular software that implement a similar strategy (Burrows-Wheeler Transform). • Can benefit from multi-processor . Practice: map the data to hg19. • “ bowtie2 [options]* -x <bt2-idx> {-1 <m1> -2 <m2> | -U <r>} [-S <sam>]”
Representation of HTS data • The importance of a reference genome • All coordinates are only meaningful for a given genome assembly. • One assembly may have multiple releases (annotations). • You need to know which reference genome was used to generate the BED file.
Retrieving HTS data • Retrieving HTS data from the web using wget. • Loading to and unloading data from UFHPC (check with HPC instructions).
How to gain knowledge from HTS data • Visualization of HTS data. • Discovering genomic patterns. • Identifying novel mechanism – hypothesis generation.
Visualization of HTS data. Simple visualization - distribution of tags (or normalized values). Barski et al. (2007) Cell Chr. ChrStartChrEndValue chr4 0 200 0 chr4 200 400 2 chr4400 600 13 chr4600 800 35 chr4800 1000 27 BedGraph file (Wig)
Visualization of HTS data. Shifting sequence tag position may be necessary to reflect nucleosome positions. In this example the mapping positions were shifted +73bp for forward strain and -73bp for reverse strain to reflect the midpoint of the nucleosome. Jiang & Pugh, Nat. Rev. Genet., 2009
Visualization of HTS data. Advanced visualization – depending on purpose of comparison. Example - Circos plot depicts genomic location, chromosomal copy number (red, copy gain; blue, copy loss). Inter-chromosomal translocations (purple) and intra-chromosomal (green) rearrangements observed in primary prostate cancers Berger et al. (2011) Nature
Manipulating Deep Seq data with Galaxy Practice & Observe: Load the PolII.H99.Bed file to Galaxy with the Get Data tool. Select “D. melanogaster Apr. 006 (BDGP R5/dm3) (dm3)” as the database Sort data based on chromosome location c2. Filter out lines with U0 with the expression c4!=‘U2’ Extract genomic sequences.
Visualizing Deep Seq data with UCSC genome browser Practice & Observe I: Load the PolII.H99.Bed file as custom track to the browser by copy/past the URL link. View ‘dense’ and then ‘full’ presentation of the track.
Visualizing Deep Seq data with UCSC genome browser Practice & Observe II: Save the landmark.bed file to your local computer. View the contents with Notepad. Load the local file to the UCSC browser. Edit the color value, save, resubmit, and observe the differences.