Download
1 / 1

E N D
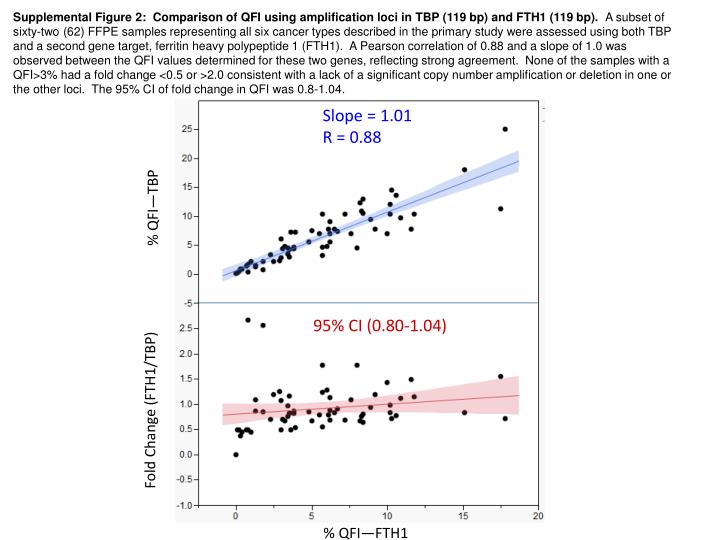
Supplemental Figure 2: Comparison of QFI using amplification loci in TBP (119 bp) and FTH1 (119 bp). A subset of sixty-two (62) FFPE samples representing all six cancer types described in the primary study were assessed using both TBP and a second gene target, ferritin heavy polypeptide 1 (FTH1). A Pearson correlation of 0.88 and a slope of 1.0 was observed between the QFI values determined for these two genes, reflecting strong agreement. None of the samples with a QFI>3% had a fold change <0.5 or >2.0 consistent with a lack of a significant copy number amplification or deletion in one or the other loci. The 95% CI of fold change in QFI was 0.8-1.04. Slope = 1.01 R = 0.88 % QFI—TBP 95% CI (0.80-1.04) Fold Change (FTH1/TBP) % QFI—FTH1
