Download
1 / 74
740 likes | 904 Views
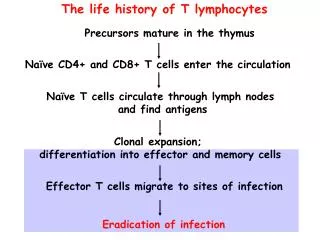
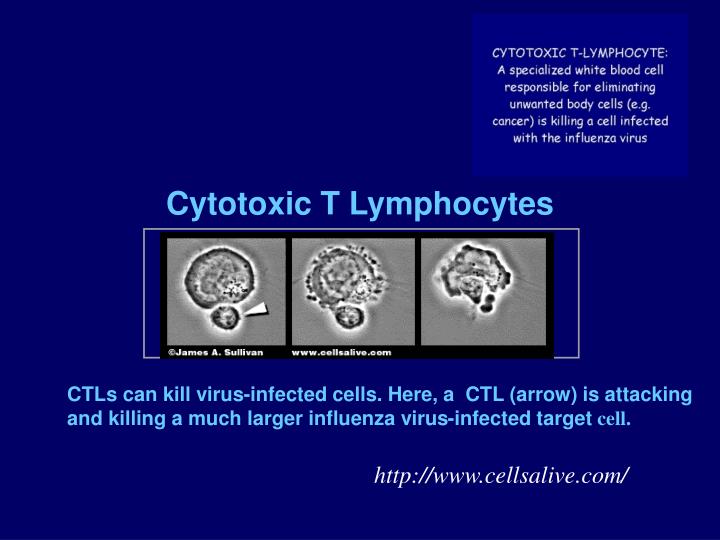
Cytotoxic T Lymphocytes. CTLs can kill virus-infected cells. Here, a CTL (arrow) is attacking and killing a much larger influenza virus-infected target cell. http://www.cellsalive.com/. Models of CTL Response. dT/dt = l – dT – kVT dT*/dt = kVT – d V T* - d E ET* dV/dt = pT* - cV

E N D
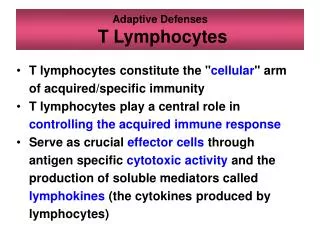
Cytotoxic T Lymphocytes CTLs can kill virus-infected cells. Here, a CTL (arrow) is attacking and killing a much larger influenza virus-infected target cell. http://www.cellsalive.com/
Models of CTL Response dT/dt = l – dT – kVT dT*/dt = kVT – dVT* - dEET* dV/dt = pT* - cV dE/dt = kEET* - mE CTL Effectors Nowak and Bangham, Science272, 74 1996
LCMV Infection LCMV Armstrong into BALB/c mice, Ahmed 1998
Simple Model of CD8 Response DeBoer … Perelson, J Virol. 75,10663 (2001), J Immunol. 171, 3928 (2003)
On-Off Model Activation function Ton = recruitment time A(0) = cells recruited
Simulating CTL Response Low affinity clones sometimes dominate 10 response V Total CTL V □, ∆,◊ are 3 highest affinity clones
Modeling the Kinetics of Hepatitis B and C Infections Alan S. Perelson, PhD Theoretical Biology & BiophysicsLos Alamos National LaboratoryLos Alamos, NM
Viral Hepatitis - Overview Type of Hepatitis A B C D E Source of feces blood/ blood/ blood/ feces virus blood-derived blood-derived blood-derived body fluids body fluids body fluids Route of fecal-oral percutaneous percutaneous percutaneous fecal-oral transmission permucosal permucosal permucosal Chronic no yes yes yes no infection Prevention pre/post- pre/post- blood donor pre/post- ensure safe exposure exposure screening; exposure drinking immunization immunization risk behavior immunization; water modification risk behavior modification
Estimates of Acute and Chronic DiseaseBurden for Viral Hepatitis, United States HAV HBV HCV HDV Acute infections (x 1000)/year* 125-200 140-320 35-180 6-13 Fulminant deaths/year 100 150 ? 35 Chronic 0 1-1.25 3.5 infections million million 70,000 Chronic liver disease deaths/year 0 5,000 8-10,000 1,000 * Range based on estimated annual incidence, 1984-1994.
Hepatitis B and C Virus • HBV is a DNA virus • Genome is very small, ~ 3.2kb, • Takes the form of a partially closed circle • Vaccine; therapy to control not cure • HCV is a positive strand RNA virus • Genome is about 9.3kb, approximately the same size as HIV • No vaccine; therapy successful in 50% of people treated
0 7 14 0.5 0 5MU 10MU -0.5 15MU -1 -1.5 -2 -2.5 -3 Mean Decrease in HCV RNA Levels Over First 14 Days of QD IFN- Treatment Days HCV Genotype 1 Mean Decrease HCV RNA(Log10 Copies/mL) Lam N. DDW. 1998 (abstract L0346).
Model of HCV Infection b Infection Rate pVirions/d I T Infected Cell Target Cell c d Loss Clearance
What if IFN blocks infection? IFN b p virions/d I T Infected Cell Target cell d c death clearance
What if IFN Blocks Production? b IFN p Virions/d I T Infected Cell e Effectiveness Target Cell c d Death/Loss Clearance
What if IFN blocks production? • If IFN treatment totally blocks virus production, then • dV/dt = - cV => V(t)=V0 e- c t • Viral load should fall exponentially with slope c. However, data shows an acute exponential fall followed by slower fall.
IFN Effectiveness in Blocking Production • Let e = effectiveness of IFN in blocking production of virus • e= 1 is 100% effectiveness • e= 0 is 0% effectiveness • dV/dt = (1 – e)pI – cV
Early Kinetic Analysis • Before therapy, assume steady state so that pI0 =cV0. Also, assume at short times, I=constant=I0, so that dV/dt= (1-e)cV0 - cV • Model predicts that after therapy is initiated, the viral load will initially change according to: V(t) = V0[1 – e + eexp(-ct)] • This equation can be fit to data and cand e estimated. • Thus drug effectiveness can be determined within the first few days!
8 7 6 5 0 1 2 10MU Log10 HCV RNA/mL Days
Viral Kinetics of HCV Genotype 1 5MU 10MU 15MU Drug Efficacy 81 ± 4% 95 ± 4% 96 ± 4% Viral Clearance Constant (1/d) 6.2 ± 0.8 6.3 ± 2.4 6.1 ± 1.9 Half-life ofVirions(Hours) 2.7 2.6 2.7 Production& Clearance Rates(1012 Virions/d) 0.4 ± 0.2 2.3 ± 4 0.6 ± 0.8
Standard Model of HCV Dynamics Equations Parameters l Supply of target cells dNet loss rate of target cells β Infectivity rate constant d Infected cell death rate e Drug efficacy p Virion production rate c Virion clearance rate constant Variables Initial Conditions T Target Cell Density I Infected Cell Density V Virus Concentration T(0) = T0 I (0) = I0 V(0) = V0
Solution: Change in Viral Load • Assuming T = constant, • When c>>δ, λ1≈ c andλ2≈ εδ where t0 = delay between treatment commencement and onset of effect
8 7 6 5 4 0 7 14 10MU Log10 HCV RNA/mL Days
Current Therapy: Peg-IFN a2b + RBV Peg-IFN given once a week Major Point: Drug Pharmacokinetics Matters!
Pegylated Interferon (Peg-IFN) • 21 HIV HCV Co-Infected Patients (A. Talal) • Dosing • 1.5 μg/kg Peg-IFN a-2b (12 kDa) weekly • 1000 or 1200 mg ribavirin daily Talal et al., Hepatology (2006)
HCV RNA and PEG-IFN α-2bTalal et al., Hepatol. (2006) PEG HCV
Pharmacodynamics Emax Model Drug concentration, C(t), affects efficacy n = Hill coefficient, EC50 = 50% effective conc. t = delay between receptor binding and effect
PK Model for Absorption & Elimination of Peg-IFN ka ke • Amount of drug in blood (A), Concentration = A/Vd • X = amount of drug remaining at absorption site • F = bioavailability • D = dose • ka = absorption rate constant • ke = elimination rate constant Absorption Site Blood absorption elimination
PK Model • Following multiple doses, • t= dosing interval and N = # of doses • Vd = volume of distribution
Difference between responders and nonrespondersTalal et al., Hepatol. (2006) • Average drug conc. - Not different • Median EC50 10-fold lower in SVR (0.04 mg/L) than NR (0.45 mg/L), P=0.014 • Median efficacy – higher in responders 0.92 vs 0.45 (P=0.02) • Median drug conc./EC50 – higher in responders 10.1 vs 1.0 (P=0.012)
Conclusions • HCV kinetic models can be used to quantitatively estimate the effectiveness of different drug regimes, and help establish appropriating dosing. • They can give quantitative insights into biology of viral infection – rates of virion production, clearance, cell loss, etc. • When using peg-IFN a2b drug effectiveness can change during the dosing interval and models need to be modified to take this into consideration.
Viral dynamics and immune responses in acute hepatitis B infection Stanca M. Ciupe, Ruy M. Ribeiro, Patrick W. Nelson, Alan S. Perelson
Patient data(Webster, Lancet 2000; Whalley, Hepatol. 2000) • HBV outbreak was identified in the UK in 1998 due to autohemotherapy • Serological exposure to the same HBV variant in 57 patients. • 7 identified in the preclinical phase and studied here.
Biphasic decay of viral load • First phase - span 56 days; • - half life 3.4 days; • Second phase - span 148 days; • - half life 23 days;
Models A number of models of HBV infection exist: Nowak & Thomas, PNAS 1996; Tsiang et al Hepatol., 1999; Levin et al Hepatol. 2001; Murray & Chisari, PNAS 2005. With exception of Murray & Chisari (2005) they were developed to analyze drug therapy and are missing a number of key features of HBV infection that are important during acute infection.
Model continued • Here we will consider that almost 100% of hepatocytes are thought be infected at the peak of the infection. Due to this both cytolytic and non-cytolytic mechanisms may be needed to clear the infection. • Further, a large amount of hepatocyte proliferation accompanies viral and cccDNA clearance in animal models (woodchuck, duck and chimpanzee) and presumably in human infection. • Key Question: As virus is cleared and uninfected hepatocytes replace infected ones, what prevents infection of these newly generated hepatocytes?
Model Cytolytic death E V k Virus production virus infection 1 cccDNA c cccDNA dilution T cure z cccDNA clearance Virus production E activation cure E s ≥2 cccDNA R E effectors E refractory Cytolytic death Cytolytic death
Parameter fitting • Assumptions: some parameter values fixed based on literature (McDonald, Tsiang, Hep. 1999, Lau, Hep. 2000, Lewin, Hep. 2001, Ahmed, Science 1996) - initial conditions (Whalley JEM 2001); • incubation time:80-140 days (Bertoletti, Hep. 2003);
Others we estimate by Monte Carlo search • Fitness function: • Search within a predefined range for parameters; • Once a good fit is found, search locally.
Model gives biphasic decay of viral load Best fit of model to data Patient 7 is the only patient not to clear HBV
ALT and Effector cells hepatocytes ALT E ALT ALT=alanine aminotransferase