Download
1 / 30
330 likes | 487 Views
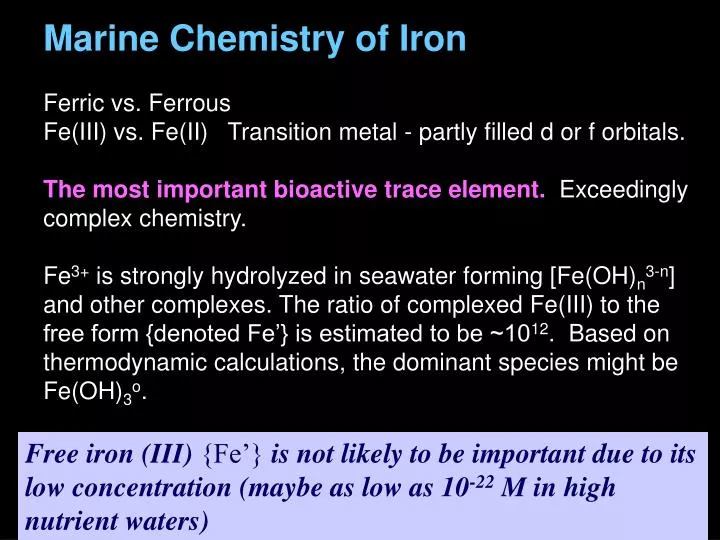
Marine Chemistry of Iron Ferric vs. Ferrous Fe(III) vs. Fe(II) Transition metal - partly filled d or f orbitals. The most important bioactive trace element. Exceedingly complex chemistry.

E N D
Marine Chemistry of Iron Ferric vs. Ferrous Fe(III) vs. Fe(II) Transition metal - partly filled d or f orbitals. The most important bioactive trace element. Exceedingly complex chemistry. Fe3+ is strongly hydrolyzed in seawater forming [Fe(OH)n3-n] and other complexes. The ratio of complexed Fe(III) to the free form {denoted Fe’} is estimated to be ~1012. Based on thermodynamic calculations, the dominant species might be Fe(OH)3o. Free iron (III) {Fe’} is not likely to be important due to its low concentration (maybe as low as 10-22 M in high nutrient waters)
TotalFe concentrations in surface waters range from < 0.1 nM (severely Fe-limited) to 1-5 nM in iron-replete waters.
Surface enrichment of Fe in N. Atlantic is from dust deposition from Africa Boyd & Ellwood, 2010
Most of the iron is complexed and some specific Fe-binding ligands are now known. • Siderophores produced by marine bacteria have recently been discovered (referred to as Aquachelins; see work of Butler et al.). • These siderophore-Fe complexes are photolabile.
North Pacific Specific Fe-binding ligands are present in the ocean, with L1 being only present near the surface. Particulate Fe (> 0.4 µm) True dissolved Fe Colloidal Fe L1 and L2 are strong and weak Fe-binding ligands, respectively. Boyd & Ellwood, 2010
Role of Colloids in Marine Fe cycle A significant fraction of the Fe may be associated with colloids (i.e adsorbed to tiny particles that don’t sink). Wells and Mayer provided data on iron colloids and they found that >50% of the operationally-“dissolved” Fe may be colloidal. Availability of Fe to phytoplankton may depend on its particle form. Some phytoplankton may not be able to take up Fe colloids, but instead may rely on photoreduction processes to make it available. (but see Nodwell and Price L&O 46: 765)
Photoreduction of Fe(III) to Fe(II) is important. Light causes reduction of Fe(III):DOM of Fe(III):colloid complexes to yield Fe(II), which is much more soluble than the oxidized form. The Fe(II) formed will rapidly oxidize back to Fe(III) with O2 or H2O2, but it will form “relatively” available amorphous Fe(III)-oxides. Most importantly, this photo-redox cycling increases the residence time of Fe in the photic zone by minimizing formation of particle-associated Fe, which sinks.
Photo-reduction of iron is important in maintaining bioavailability in surface waters. Light energy Light energy Photo-reduction Iron (III)-ligand complex Ligand binding Free oxidized Fe Fe transport Oxidized ligand oxidants Free reduced Fe Sunda, 2012
Aeolian transport of Fe is very important (>95% of Fe input to surface waters is from the atmosphere, mainly as dust (Duce and Tindale, 1991).
Aeolian transport continued. Surface water enrichments of Fe are seen in some places – but Fe is rapidly scavenged from the surface water and water just below the mixed layer, due to biological and chemical processes. Fe Scavenging Intensity • Scavenging rates determined with 234Th (mainly Th in the +IV oxidation state) which has a chemistry similar to that of Fe, shows that subsurface (60-100m) removal of Fe likely occurs. deposition recycling Fe Fe mixed layer Depth (m) mixing Fe Fe transported out of mixed layer is probably scavenged and deposited to sediments rather than being mixed back up to surface. Thus, upwelling of mid-depth waters is a poor source of Fe. This results in low Fe levels in parts of the ocean that limit primary productivity. 1% light level Scavenging export
N2 fixation enzymes require lots of iron. Summary table of geographic distribution of N2 fixation in relation to nutrient status Dissolved Fe Fe-replete Fe-poor Relatively low N2 fixation Fe-poor Fe-poor Fe-replete Fe-replete; P limited Fe-replete Sohm et al. 2011
Fe inputs to the ocean are connected with atmospheric CO2 and probably climate High Fe, low CO2 Low Fe, high CO2 Depth in ice core (m) The historical record of atmospheric CO2 and Fe deposition as measured in an ice core (probably from Greenland). Taken from Millero (1996)
Large-scale Iron Fertilization Experiments Brainchild of John H. Martin of the Moss Landing Laboratory Fe-Ex I Fe-Ex II Sooiree EisenEx Equatorial Pacific Southern Ocean Fe(II) SF6 mixture released and the water mass tracked lagrangian style Many other Fe-Fertilization experiments have now been conducted
Annual average mixed layer nitrate concentration (µM) Boyd et al 2007
Changes in Chl a and primary productivity in Fe fertilized patch during IronEx I IRONEX I conducted in 1993 at 5o S, 90o W, south of the Galapagos Islands
Fe-Ex I produced a relatively small response Based on Fe-Ex I (taken from Millero)
Changes in nitrate and chlorophyll a profiles after Fe fertilization during Iron Ex II (1996) Days after Fe addition From Coale et al., 1996
NO3- Fluor pCO2 From Millero, 1996 IRONEX II conducted at 3o S, 104o W
CO2 drawdown during IronEx II The fCO2 is plotted against SF6, the tracer used to tag the Fe-fertilized water mass. The higher the SF6, the closer to the center of the patch. The overall decline in SF6 over time was due to outgassing and vertical mixing. From Coale et al, 1996
Do results of Fe fertilization experiments represent what would happen with natural Fe supply? How are they different? Were the chemical and biological responses observed representative of what would be expected with natural inputs of Fe? Is Fe fertilization a workable strategy to increase primary production (and associated fisheries yield), and to draw CO2 out of the atmosphere (to mitigate global warming)?
Natural iron fertilization on the Kerguelen Plateau – in the Fe-starved Southern Ocean Blain et al., 2007 Nature 446 Low pCO2
Evidence for Fe and vitamin B12 Co-limitation of primary production in the Ross Sea, Antarctica Bertrand et al. 2007 L&O 53: Vitamin B12 (cyanocobalamin) contains the trace element cobalt (Co). B12 is not produced by algae but it is by bacteria
Photo-reduction Fig 9.25 in 3rd Edition From Millero, 1996
Wells (1997) suggested that laminations of diatom tests in equatorial sediments may have originated from blooms of diatoms produced by changes in the Fe concentration of the Equatorial undercurrent. This may have been caused by tectonic activity near the source waters of this current, near Indonesia. Nitrate supported growth in phytoplankton requires more Fe than ammonium supported growth because nitrate reductase contains Fe!
Cobalt (Co) • Present in cyanocobalamin (vitamin B12), a methyl carrier in biochemistry. • Present at only 4-50 pM in North Pacific. Could be biolimiting. • A required growth factor for some species. Uptake may be enhanced by organic complexation (as with Fe). • Recent evidence for a cobalt binding ligand in seawater, similar to that of Cu and Zn ligands. • Prymnesiophytes have a higher Co requirement than diatoms. Required for production of methylated compounds?
Fe:C ratios in phytoplankton and exported particles. Values are generally higher in Fe-replete areas Fe-starved HNLC areas Fe-replete areas Boyd et al 2007
Changes in Fe concentrations in a mesoscale eddy over time 12 months later Eddy just formed Typical “mature water mass” Fe profile Boyd & Ellwood, 2010
Multiple sources of new iron to the southern ocean Island wake Dust Sea ice Island wake Bathymetric upwelling Iceberg Dust Fe-rich sediments Eddys & sediments Boyd & Ellwood 2010