Download
1 / 23
230 likes | 336 Views
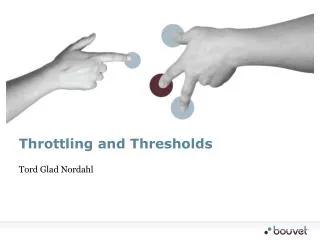
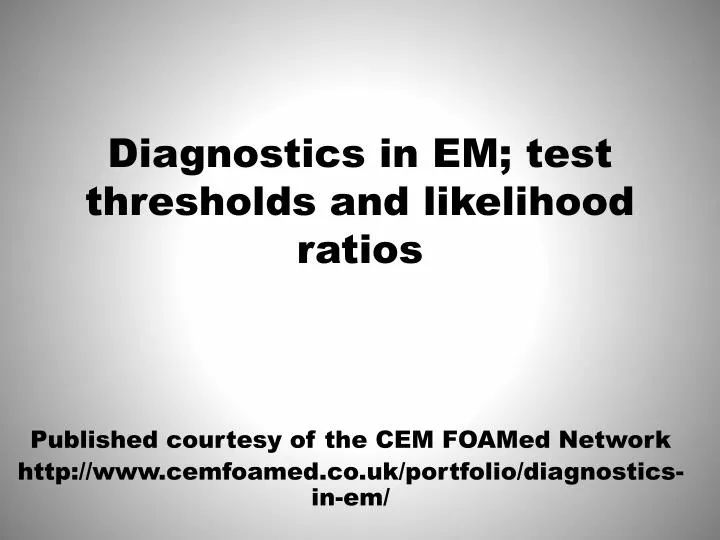
Diagnostics in EM; test thresholds and likelihood ratios. Published courtesy of the CEM FOAMed Network http:// www.cemfoamed.co.uk /portfolio/diagnostics-in- em /. Everything we do in a patient assessment is a test Including questions we ask. Test thresholds.

E N D
Diagnostics in EM; test thresholds and likelihood ratios Published courtesy of the CEM FOAMed Network http://www.cemfoamed.co.uk/portfolio/diagnostics-in-em/
Everything we do in a patient assessment is a testIncluding questions we ask
Below a test threshold;more likely to harm than help a patient by testing
Above a test threshold; more likely to harm than help a patient by testing
How do we use all of this information?? 100 % Likelihood of diagnosis being correct Diagnosis considered Below test threshold 0%
How do we use all of this information?? 100 % Above test threshold Likelihood of diagnosis being correct Diagnosis considered 0%
How do we use all of this information?? 100 % Above test threshold Appropriate testing Likelihood of diagnosis being correct Diagnosis considered Below test threshold 0%
Application of serial tests 100 % Finding 3 Above test threshold Finding 2 Likelihood of diagnosis being correct Finding 1 Diagnosis considered Below test threshold 0%
Correct testingCorrect testCorrect circumstanceCorrect patient
Perry et al. Sensitivity of coputed tomography performed within six hours of onset of headache for diagnosis of subarachnoid haemorrhage: prospective cohort study. BMJ 2011; 343:d4277 doi. 10.1136/bmj.d4277
Han et al., The Role of Cardiac Risk Factor Burden in Diagnosing Acute Coronary Syndromes in the Emergency Department Setting. Ann Emerg Med. 2007; 49
Who not to test 100 % Likelihood of diagnosis being correct Diagnosis considered Below test threshold 0%
Who not to test but to treat 100 % Above test threshold Likelihood of diagnosis being correct Diagnosis considered 0%
Who should be tested 100 % Appropriate testing Likelihood of diagnosis being correct Diagnosis considered 0%
Correct testingCorrect testCorrect circumstanceCorrect patient