Download
1 / 25
250 likes | 373 Views
AMATS AREA TRAFFIC CRASHES 2010-2012. AMATS AREA TRAFFIC CRASHES 2010-2012 Presentation Overview. Current Highway Safety Issues Crash trends in the AMATS area Criteria for High Crash Locations High Crash Sections and Intersections ODOT Safety Program.

E N D
AMATS AREA TRAFFIC CRASHES 2010-2012 Presentation Overview • Current Highway Safety Issues • Crash trends in the AMATS area • Criteria for High Crash Locations • High Crash Sections and Intersections • ODOT Safety Program
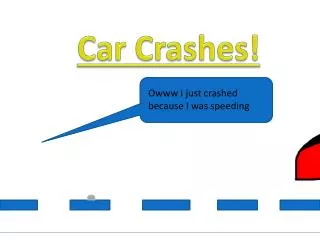
Current Safety Issues - Distracted Driving • Distracted driving is any non-driving activity that has the potential to distract from the primary task of driving • Hard to determine how many crashes this causes • Ohio House Bill 99 (August 31, 2012) prohibits texting while driving for all ages and also prohibits texting and cell phone use for drivers under 18 • New OH-1 Report that investigating police officer fills out now has a distracted driving section.
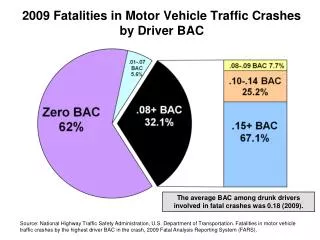
Current Safety Issues - Alcohol Related Crashes • Over 4% of all crashes in 2010-2012 (2,227) • Over 44% of all fatal crashes • Usually loss of control and hitting a fixed object • Peak around 2:00 AM
Current Safety Issues – Youth andSenior Related Crashes • Ages 16-25 and over 65 years old • Youth - Largest % of overall crashes (over 40%) and largest % of fatalities (over 25%) • Experience issues, don’t calculate risk well • Age 65 and up are a rapidly growing % of drivers and account for about 14% of all crashes in our area • Usually good drivers but may have vision and reaction time issues
Youth and Senior Crashes Senior Crashes Youth Crashes
AMATS Crash Trends – Total Crashes • 2012 total crashes are down slightly from 2011 • 17,011 to 16,633 (-378) • Excludes animal and construction zone crashes • 31% are rear end collisions • 27% occur between 3:00 and 5:00 PM
AMATS Crash Trends – Injuries • 2012 injuries are down slightly from 2011 • 4,271 to 4,173 (-98) • Severe injuries up slightly from 484 to 512 (+28)
AMATS Crash Trends - Fatalities • 2012 fatalities are down slightly from 2011 • 47 to 44 (-3) • Tend to occur at night past 8:00 PM • Usually involve speeding, loss of control and hitting a fixed object
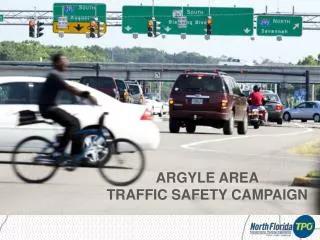
AMATS Crash Trends – Bicycle Related • 2012 bicycle related crashes decreased from 2011 • 111 to 103 (-8) • 331 total for the three year period, less than 1% of all crashes • Over 78% result in an injury • 21% of bicycle related crashes involve children age 12 and under
AMATS Crash Trends – Pedestrian Related • 2012 pedestrian related crashes decreased from 2011 • 177 to 148 (-29) • 481 total for the three year period, less than 1% of all crashes • Over 86% result in an injury • 12% of pedestrian related crashes involve children age 12 and under
High Crash Criteria • ROADWAY SECTIONS • Minimum of 10 crashes per mile per year • Minimum crash rate of 1.0 crash per million vehicle miles traveled • INTERSECTIONS • Minimum of 10 crashes in the three year period • Minimum crash rate of 1.0 crash per million approach vehicles
Ranking The Locations • A composite score is calculated • The composite score is an overall score derived from where a location is ranked according to: • Total number of crashes • Crash rate • Severity Index • The composite score considers number of crashes, traffic volume and crash severity
Highway Sections • 123 highway sections meet the minimum criteria of ten crashes per mile per year and a minimum crash rate of 1.0 crash per million vehicles miles traveled • Highway sections are listed in Table 1 of the crash memorandum
M L King Jr. Blvd from W. Market to N. Broadway N Howard St N Main St W Market St N High St Many crashes occur where the freeway transitions to a street N Broadway St MLK Jr Fwy
2. W. Exchange St from Rhodes Ave to Dart Ave Left Turn from Curb Lane Only Many crashes occur in this segment because vehicles turn left from this lane
Highway Intersections • 263 intersections meet the minimum criteria of ten crashes in the three year period and a crash rate of 1.0 crash per million approach vehicles • Intersections are listed in Table 2 of the crash memorandum
M L King Jr. Blvd and N. Main/N. Howard St N Howard St MLK Jr Blvd N Main St W Market St N High St N Broadway St
Tallmadge Circle – 284 Crashes (2010-2012) • Ranked number one for number of crashes • Ranked 25th overall because of low crash severity and crash rate
Freeways • Freeway safety analysis done by the Ohio Department of Transportation (ODOT) • Entire statewide freeway system is analyzed • ODOT is currently finalizing freeway crashes for 2010 – 2012 and when it becomes available we will post it on our website as part of this memorandum.
ODOT Safety Program • ODOT has one of the largest safety programs in the country and spends about $72 million $100 million annually on projects that address high and severe crash locations on any public road. • Applications due in central office on April 30 and September 30, due in district office approximately six weeks earlier • Funding available for studies, design, right of way, and construction • Typical requests range from $50,000 to $5 million. • Local match required is usually 10%
ODOT Safety Program • Funding for safety projects can only be applied for once a location is identified. • A safety location can only be identified if the crash data is sent to the Ohio Department of Public Safety (ODPS) • Please make sure your police department is sending all crash reports to ODPS!
Conclusions • Total crashes, injuries, and fatalities down slightly from 2011 • All the locations in the tables are eligible for ODOT Highway Safety Program (HSP) funding • Funding can be used for studies, design, right of way, and construction • Contact David Griffith from District 4 or Julie Cichello from District 3 for more information • All the locations are sorted by community on our website so you can easily look at your locations • Please feel free to contact AMATS with questions about this memorandum or more information about a specific location.