Download
1 / 44
440 likes | 735 Views
Statistics for Microarrays. Multiple Testing and Prediction and Variable Selection. Class web site: http://statwww.epfl.ch/davison/teaching/Microarrays/. cDNA gene expression data. mRNA samples. Data on G genes for n samples. sample1 sample2 sample3 sample4 sample5 …

E N D
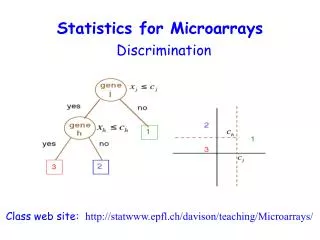
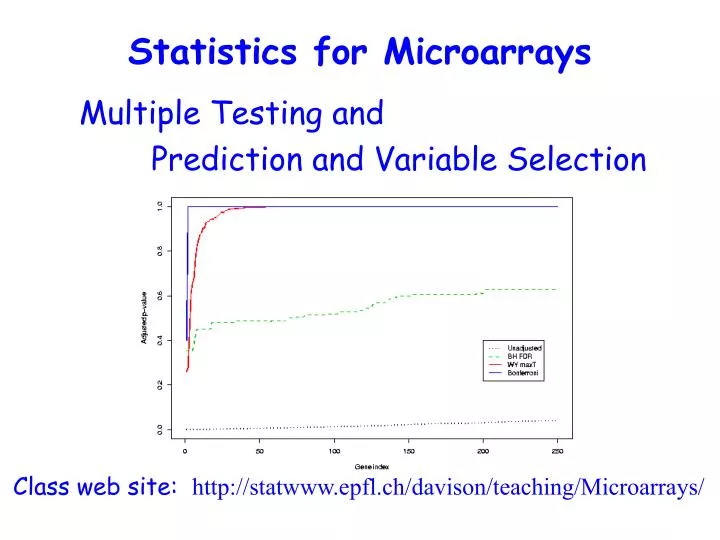
Statistics for Microarrays Multiple Testing and Prediction and Variable Selection Class web site: http://statwww.epfl.ch/davison/teaching/Microarrays/
cDNA gene expression data mRNA samples Data on G genes for n samples sample1 sample2 sample3 sample4 sample5 … 1 0.46 0.30 0.80 1.51 0.90 ... 2 -0.10 0.49 0.24 0.06 0.46 ... 3 0.15 0.74 0.04 0.10 0.20 ... 4 -0.45 -1.03 -0.79 -0.56 -0.32 ... 5 -0.06 1.06 1.35 1.09 -1.09 ... Genes Gene expression level of gene i in mRNA samplej = (normalized) Log(Red intensity / Green intensity)
Multiple Testing Problem • Simultaneously test G null hypotheses, one for each gene j Hj: no association between expression level of gene j and the covariate or response • Because microarray experiments simultaneously monitor expression levels of thousands of genes, there is a large multiplicity issue • Would like some sense of how ‘surprising’ the observed results are
Hypothesis Truth vs. Decision Decision Truth
Type I (False Positive) Error Rates • Per-family Error Rate PFER = E(V) • Per-comparison Error Rate PCER = E(V)/m • Family-wise Error Rate FWER = p(V ≥ 1) • False Discovery Rate FDR = E(Q), where Q = V/R if R > 0; Q = 0 if R = 0
Strong vs. Weak Control • All probabilities are conditional on which hypotheses are true • Strong control refers to control of the Type I error rate under any combination of true and false nulls • Weak control refers to control of the Type I error rate only under the complete null hypothesis (i.e. all nulls true) • In general, weak control without other safeguards is unsatisfactory
Comparison of Type I Error Rates • In general, for a given multiple testing procedure, PCER FWER PFER, and FDR FWER, with FDR = FWER under the complete null
Adjusted p-values (p*) • If interest is in controlling, e.g., the FWER, the adjusted p-value for hypothesis Hj is: pj* = inf {: Hj is rejected at FWER } • Hypothesis Hj is rejected at FWER if pj* • Adjusted p-values for other Type I error rates are similarly defined
Some Advantages of p-value Adjustment • Test level (size) does not need to be determined in advance • Some procedures most easily described in terms of their adjusted p-values • Usually easily estimatedusing resampling • Procedures can be readily compared based on the corresponding adjusted p-values
A Little Notation • For hypothesis Hj, j = 1, …, G observed test statistic: tj observed unadjusted p-value: pj • Ordering of observed (absolute) tj: {rj} such that |tr1| |tr2| … |trG| • Ordering of observed pj: {rj} such that |pr1| |pr2| … |prG| • Denote corresponding RVs by upper case letters (T, P)
Control of the FWER • Bonferroni single-step adjusted p-values pj* = min (Gpj, 1) • Holm (1979)step-down adjusted p-values prj* = maxk = 1…j {min ((G-k+1)prk, 1)} • Hochberg (1988) step-down adjusted p-values (Simes inequality) prj* = mink = j…G {min ((G-k+1)prk, 1) }
Control of the FWER • Westfall & Young (1993) step-down minP adjusted p-values prj* = maxk = 1…j { p(maxl{rk…rG} Pl prkH0C )} • Westfall & Young (1993) step-down maxT adjusted p-values prj* = maxk = 1…j { p(maxl{rk…rG} |Tl| ≥ |trk| H0C )}
Westfall & Young (1993) Adjusted p-values • Step-down procedures: successively smaller adjustments at each step • Take into account the joint distribution of the test statistics • Less conservative than Bonferroni, Holm, or Hochberg adjusted p-values • Can be estimated by resampling but computer-intensive (especially for minP)
maxT vs. minP • The maxT and minP adjusted p-values are the same when the test statistics are identically distributed (id) • When the test statistics are not id, maxT adjustments may be unbalanced (not all tests contribute equally to the adjustment) • maxT more computationally tractable than minP • maxT can be more powerful in ‘small n, large G’ situations
Control of the FDR • Benjamini & Hochberg (1995): step-up procedure which controls the FDR under some dependency structures prj* = mink = j…G { min ([G/k] prk, 1) } • Benjamini & Yuketieli (2001): conservative step-up procedure which controls the FDR under general dependency structures prj* = mink = j…G { min (Gj=1G[1/j]/k] prk, 1) } • Yuketieli & Benjamini (1999): resampling based adjusted p-values for controlling the FDR under certain types of dependency structures
Identification of Genes Associated with Survival • Data: survival yi and gene expression xij for individuals i = 1, …, n and genes j = 1, …, G • Fit Cox model for each gene singly: h(t) = h0(t)exp(jxij) • For any gene j = 1, …, G, can test Hj: j = 0 • Complete null H0C: j = 0 for all j = 1, …, G • The Hj are tested on the basis of the Wald statistics tj and their associated p-values pj
Datasets • Lymphoma(Alizadeh et al.) 40 individuals, 4026 genes • Melanoma(Bittner et al.) 15 individuals, 3613 genes • Both available at http://lpgprot101.nci.nih.gov:8080/GEAW
Other Proposals from the Microarray Literature • ‘Neighborhood Analysis’, Golub et al. • In general, gives only weak control of FWER • ‘Significance Analysis of Microarrays (SAM)’ (2 versions) • Efron et al. (2000): weak control of PFER • Tusher et al. (2001): strong control of PFER • SAM also estimates ‘FDR’, but this ‘FDR’ is defined as E(V|H0C)/R, not E(V/R)
Controversies • Whether multiple testing methods (adjustments) should be applied at all • Which tests should be included in the family (e.g. all tests performed within a single experiment; define ‘experiment’) • Alternatives • Bayesian approach • Meta-analysis
Situations where inflated error rates are a concern • It is plausible that all nulls may be true • A serious claim will be made whenever any p < .05 is found • Much data manipulation may be performed to find a ‘significant’ result • The analysis is planned to be exploratory but wish to claim ‘sig’ results are real • Experiment unlikely to be followed up before serious actions are taken
References • Alizadeh et al. (2000) Distinct types of diffuse large B-cell lymphoma identified by gene expression profiling. Nature 403: 503-511 • Benjamini and Hochberg (1995) Controlling the false discovery rate: a practical and powerful approach to multiple testing. JRSSB 57: 289-200 • Benjamini and Yuketieli (2001) The control of false discovery rate in multiple hypothesis testing under dependency. Annals of Statistics • Bittner et al. (2000) Molecular classification of cutaneous malignant melanoma by gene expression profiling. Nature 406: 536-540 • Efron et al. (2000) Microarrays and their use in a comparative experiment. Tech report, Stats, Stanford • Golub et al. (1999) Molecular classification of cancer. Science 286: 531-537
References • Hochberg (1988) A sharper Bonferroni procedure for multiple tests of significance. Biometrika 75: 800-802 • Holm (1979) A simple sequentially rejective multiple testing procedure. Scand. J Statistics 6: 65-70 • Ihaka and Gentleman (1996) R: A language for data analysis and graphics. J Comp Graph Stats 5: 299-314 • Tusher et al. (2001) Significance analysis of microarrays applied to transcriptional responses to ionizing radiation. PNAS 98: 5116 -5121 • Westfall and Young (1993) Resampling-based multiple testing: Examples and methods for p-value adjustment. New York: Wiley • Yuketieli and Benjamini (1999) Resampling based false discovery rate controlling multiple test procedures for correlated test statistics. J Stat Plan Inf 82: 171-196
Prediction and Variable Selection • Substantial statistical literature on model selection for minimizing prediction error • Most of the focus is on linear models • Almost universally assumed (in the statistics literature) that n > (or >>) p, the number of available predictors • Other fields (e.g. chemometrics) have been dealing with the n << p problem
Model Selection (Generic) • Select the class of models to be considered (e.g. linear models, regression trees, etc) • Use a procedure to compare models in the class • Search the model space • Assess prediction error
Model Selection and Assessment • The generalization performance of a learning method relates to its prediction capability on independent test data • This performance guides model choice • Performance is a measure of quality of the chosen model
Bias, Variance, and Model Complexity • Test error (or generalization error) is the expected prediction error over an independent test sample Err = E[L(Y, f(X))] • Training error is the average loss over the training sample Err = (1/n) ni=1 L(yi, f(xi)) ^ ^
Error vs. Complexity High Bias Low Variance Low Bias High Variance Prediction Error Test sample Training sample Model Complexity
Using the data • Ideally, divide data into 3 sets: • Training set: used to fit models • Validation set: used to estimate prediction error for model selection • Test set: used to assess the generalization error for the final model • How much training data are ‘enough’ depends on signal-noise ratio, model complexity, etc. • Most microarray data sets too small for dividing further
Approximate Validation Methods • Analytic Methods include • Akaike information criterion (AIC) • Bayesian information criterion (BIC) • Minimum description length (MDL) • Sample re-use methods • Cross-validation • Bootstrap
Some Approaches when n < p • Some kind of initial screening is essential for many types of models • Rank genes in terms of variance (or coefficient of variation) across samples, use only biggest • Dimensionality reduction through principal components, use the first (some number) PCs as variables
Parametric Variable Selection (I) • Forward selection: start with no variables; add additional variables satisfying some criterion • Backward elimination: start with all variables; delete variables one at a time according to some criterion until some stopping rule is satisfied • ‘Stepwise’: after each variable added, test to see if any previously selected variable may be deleted without appreciable loss of explanatory power
Parametric Variable Selection (II) • Sequential replacement: see if any variables can be replaced with another, according to some criterion • Generating all subsets: provided the number of variables is not too large and the criterion assessing performance is not too difficult or time-consuming to compute • Branch and bound: divide possible subsets into groups (branches), search of some sub-branches may be avoided if exceed bound on some criterion
An Intriguing Approach • Gabriel and Pun (1979): suggested that when an exhaustive search infeasible, may be possible to separate variables into groups for which an exhaustive search is feasible • For linear model, grouping would be such that regression sum of squares is additive for variables in different groups (orthogonal; also under certain other conditions) • But hard to see how to extend to other types of models, e.g. survival
Tree-based Variable Selection • Tree-based models most often used for prediction, with little attention to details on the chosen model • Trees can be used to identify subsets of variables with good discriminatory power via importance statistics • An idea is to use bagging to generate a collection of tree predictors and importance statistics for each variable; can then rank variables by their (median, say) importance • Create a prediction accuracy criterion for inclusion of variables in the final subset
Genomic Computing for Variable Selection • A type of evolutionary computing algorithm • Goal is to evolve simple explanatory rules with high explanatory power • May do better than tree-based methods, where variables selected on the basis of their individual importance (but bagging may improve this)
What this course covered • Biological basics of (mostly cDNA) microarray technology • Special problems arising, particularly regarding normalization of arrays and multiple hypothesis testing • Some ways that standard statistical techniques may be useful • Some ways that more sophisticated techniques have been/may be applied • Examples of areas where more research is needed
What was left out • Pathway modeling • This is a very active field, as there is much interest in picking out genes working together based on expression • My view is that progress here will not come from generic ‘black box’ methods, but will instead require highly collaborative, directed modeling • A comprehensive review of methods developed for analysis of microarray data • Instead, we have covered what are, in my opinion, some of the most important and fundamentally justifiable methods
Perspectives on the future • Technologies are evolving, don’t get too ‘locked in’ to any particular technology • Keep an open mind to various problem-solving approaches… • …But that doesn’t mean not to think!
Important Applications Include… • Identification of therapeutic targets • Molecular classification of cancers • Host-parasite interactions • Disease process pathways • Genomic response to pathogens • Many others
Acknowledgements • Debashis Ghosh • Erin Conlon • Sandrine Dudoit • José Correa