Download

1 / 12
120 likes | 238 Views
Section 6-4 Sampling Distributions and Estimators. Key Concept.

E N D
Section 6-4 Sampling Distributions and Estimators
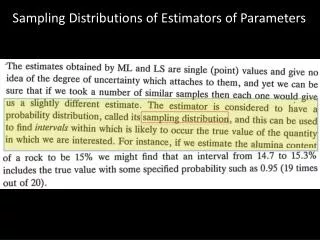
Key Concept The main objective of this section is to understand the concept of a sampling distribution of a statistic, which is the distribution of all values of that statistic when all possible samples of the same size are taken from the same population. We will also see that some statistics are better than others for estimating population parameters.
Definitions • The sampling distribution of a statistic (such as the sample proportion or sample mean) is the distribution of all values of the statistic when all possible samples of the same size n are taken from the same population. • The value of a statistic, such as the sample mean x, depends on the particular values included in the sample, and generally varies from sample to sample. This variability of a statistic is called sampling variability.
The sampling distribution of a proportion is the distribution of sample proportions, with all samples having the same sample size n taken from the same population.
Properties • Sample proportions tend to target the value of the population proportion. (That is, the mean of all possible sample proportions = mean of the population proportion.) • Under certain conditions, the distribution of the sample proportion can be approximated by a normal distribution.
The sampling distribution of the mean is the distribution of sample means, with all samples having the same sample size n taken from the same population. (The sampling distribution of the mean is typically represented as a probability distribution in the format of a table, probability histogram, or formula.)
Example When two births are randomly selected, the sample space is: {bb, bg, gb, gg} Those four equally likely outcomes suggest the following probability distribution for the number of girls from 2 births: Here is the sampling distribution for theproportionof girls: We usually describe a sampling distribution using a table that lists values of the sample statistic along with their corresponding probabilities.
Example - Sampling Distributions A population consists of the values 1, 2, and 5. We randomly select samples of size 2 with replacement. There are 9 possible samples. What are they? a. For each sample, find the mean, median, range, variance, and standard deviation. b. For each statistic, find the mean from part (a)
Fill in the table (part a) (For each sample, find the mean, median, range, variance, and standard deviation).
Mean of statistics : ___ ___ ___ ___ ____ ____ Population Parameter: ___ ___ ___ ___ ____ ____ Does the sample statistic target the population parameter? ____ ___ ___ ___ ___ ____ Fill in the bottom row (part b): (For each statistic, find the mean from part (a))
Interpretation of Sampling Distributions We can see that when using a sample statistic to estimate a population parameter, some statistics are good in the sense that they target the population parameter and are therefore likely to yield good results. Such statistics are called unbiased estimators. Statistics that target population parameters: mean, variance, proportion Statistics that do not target population parameters: median, range, standard deviation