Download

1 / 23
230 likes | 569 Views
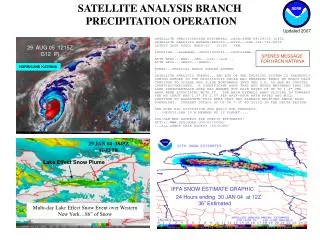
SATELLITE ANALYSIS BRANCH PRECIPITATION OPERATION. June 23 0645Z. Updated 2007. TEXAS. 29 AUG 05 1215Z G12 IR. SPENES MESSAGE FOR HRCN KATRINA. HURRICANE KATRINA. GOES 10 Infrared 9/1/03. 29 JAN 04 1845Z G-12 IR. Lake Effect Snow Plume.

E N D
SATELLITE ANALYSIS BRANCH PRECIPITATION OPERATION June 23 0645Z Updated 2007 TEXAS 29 AUG 05 1215Z G12 IR SPENES MESSAGE FOR HRCN KATRINA HURRICANE KATRINA GOES 10 Infrared 9/1/03 29 JAN 04 1845Z G-12 IR Lake Effect Snow Plume IFFA SNOW ESTIMATE GRAPHIC GOES-12 Infrared 9/5/03 GOES-12 Visible 9/18/03 24 Hours ending 30 JAN 04 at 12Z 36” Estimated Multi-day Lake Effect Snow Event over Western New York…86” of Snow SNOW STORM 7 DEC 2003 0315Z G12- IR
WHY ARE SATELLITE RAINFALL ESTIMATES USED/NEEDED? • SUPPLEMENTS RADAR AND RAIN GAUGES– where there is inadequate rain gauge coverage, no radar coverage, or missing radar coverage • SPATIAL CONSISTENCY – only one instrument (GOES satellite) to calibrate rather than multiple radars. Thus there are no calibration differences, range effects, or beam block problems that can occur with radar.
Precipitation Operation of SAB Purpose: To provide satellite-derived weather analysis and precipitation estimates to the National Weather Service (NWS) in support of Flash Flood /Heavy Snow Watches, Warnings, and Advisories. Location: Lower 48 states; Puerto Rico; Hawaii Customers: NWS – Forecast Offices (WFOs), River Forecast Centers (RFCs), Hydrometeorological Prediction Center (HPC) Distribution: AWIPS and Internet Satellite Data Used:GOES and Polar Imagery
PRECIPITATION OPERATION OF NOAA/NESDIS/SATELLITE ANALYSIS BRANCH • Products • SPENES Alphanumeric Guidance Messages - lists estimates and provides satellite analysis and flash flood/heavy precipitation guidance • Satellite Estimate Graphics • Regular Briefings and Support for the Hydrometeorological Prediction Center (HPC) • AWIPS 12 Planet Chat Discussions with Weather Forecast Offices (WFOs) and River Forecast Centers (RFCs) • Location • Lower 48 states; Puerto Rico; Hawaii • Purpose • To provide satellite-derived (weather) analysis, trends, and precipitation estimates to the National Weather Service (NWS) in support of Flash Flood/Heavy Snow Watches, Warnings, and Advisories. • Satellite Data Used • GOES 11 & 12: IR, WV, Vis Imagery; Derived Product Imagery; GOES Sounder Data. • DMSP SSM/I (Defense Meteorological Satellite Program Special Sensor Microwave Imager) rain rates and PW data. • NOAA AMSU (Advanced Microwave Sounder Unit) rain rates and PW. • NASA TRMM (Tropical Rainfall Measuring Mission) rain rates • NASA AMSR-E (Advanced Microwave Scanning Radiometer-EOS) rain rates and PW • Product Frequency • As needed - when flash flooding/heavy snow is occurring or is developing. • IFFA (Interactive Flash Flood Analyzer) • McIDAS based computer system used to do satellite analysis and derive rainfall estimates interactively using the following techniques: • Convective Storm Technique (cold and warm tops) - most frequently used. • Winter Storm Technique - for rain and snow with extratropical cyclones. • Tropical Storm Technique - for tropical storms and hurricanes. • Lake Effect Snow. • Automated Satellite Estimates • McIDAS based algorithm that derives estimates quickly with little human intervention - became operational in June 2000; Hydro-Estimator version • became operational in September 2002. • Customers • National Weather Service (NWS) - Forecast Offices, River Forecast Centers, and the Hydrometeorological Prediction Center (HPC). • Distribution • Internet http://www.ssd.noaa.gov/PS/PCPN/; Advanced Weather Interactive Processing System (AWIPS)
HISTORY OF IFFA/QPE OPERATION • 1979FirstEstimates – Scofield/Oliver Convective Technique • 1983 - Fully Operational - using McIDAS system – Interactive Flash Flood Analyzer (IFFA) - SPENES messages on AFOS • 1993 – NESDIS/SAB Collocated with NCEP/HPC, forming NPPU - better QPF support • 1996 - Estimate Graphics and SPENES messages on Internet - SSD Web Page • 1997 - Orographic Correction added - for short-term estimates • 2000 - Combined IFFA/Auto-Estimator Operation • 2002 – Hydroestimator – new version of Auto-Estimator
Satellite Analysis BranchPrecipitation Products and Services For WSFOs/RFCs - lower 48 states/Puerto Rico/Hawaii: Satellite Precipitation Estimate Messages (SPENES) and graphics–issued for excessive rain/heavy snow events For Hydrometeorological Prediction Center (HPC): Satellite Briefings and Precipitation Estimates -used by HPC as input for QPF graphics and discussions
SPENES Contents • Satellite Analysis and Trends • Precipitation Estimates - Manual (IFFA) or • Automated (Hydroestimator) Satellite Data Used: GOES IR, VIS, WV GOES Sounder and Imager Data/Derived Product Imagery (DPI) GOES Satellite Winds Microwave: DMSP SSM/I (rain rates and PW) NOAA AMSU (rain rates and PW) NASA TRMM (rain rates) NASA AMSR-E (rain rates and PW)
Additional Input for SPENES’s • Surface and Upper Air Data and Analyses • Radar – NAWIPS • Model Data - from AWIPS and NAWIPS • Blended Products – GOES/Polar satellite, model, and observational data • Internet Data
Example of SPENES message ZCZC NFDSPENES ALL SPENES . SATELLITE PRECIPITATION ESTIMATES..DATE/TIME 10/01/07 1505Z SATELLITE ANALYSIS BRANCH/NESDIS---NPPU---TEL.301-763-8678 LATEST DATA USED: GOES-12 1445Z AB . LOCATION...FLORIDA... . ATTN WFOS...MFL...KEY... ATTN RFCS...SERFC... . EVENT... PERSISTENT RAIN EVENT . SATELLITE ANALYSIS AND TRENDS... GOES-12 WATER VAPOR IMAGERY AT 1445Z SHOWED A MID/UPR LEVEL CIRCULATION OVER THE SE GULF OF MEXICO. AN ELONGATED TROUGH EXTENDS FROM THE FLORIDA KEYS TO THE BAHAMAS WITH LOW LEVEL CIRCULATIONS NEAR 24.2N 81.5W(FLORIDA KEYS) AND 25.5N 77.5W(BAHAMAS). DEEP LAYERED TROPICAL MOISTURE IS FOCUSED ON SOUTHERN FLORIDA(MIAMI-DADE AND BROWARD) WHERE THE PW's ARE AROUND 2.00 INCHES(121 PERCENT OF NORMAL). EVEN THOUGH TOPS HAVE WARMED DURING THE LAST HOUR EXPECT CONVECTION TO INCREASE AND CONTINUE TO MOVE OVER THE AREA. HOURLY RATES OF .8" TO 1.6"/HR ARE OVER S MIAMI-DADE AND THE N KEYS. . HYDRO-ESTIMATES6HR TOTALS(0800-1400Z) S FLORIDA COUNTIES... MIAMI DADE 6.2" . SEE NCEP HPC DISCUSSION AND QPF/S FOR FORECAST. ....NESDIS IS A MEMBER OF 12 PLANET.... . SSD/SAB WEB ADDRESS FOR PRECIP ESTIMATES: HTTP://WWW.SSD.NOAA.GOV/PS/PCPN/ ...ALL LOWER CASE EXCEPT /PS/PCPN/ . LAT...LON 2611 8113 2571 7996 2477 8038 2520 8145 2594 8112 . NNNN
Example of SATELLITE HYDROESTIMATOR GRAPHIC from Satellite Services Division Web Page
SAB NPPU SUPPORT FOR HPC • Scheduled Briefings * 0-6 hr. QPF update and Flash Flood Potential; 4 times/day • * 12 hr. Basic Weather Prog; 2 times/day • Continuous coordination resatellite trends/precipitation estimates - • input into QPF graphic forecasts and HPC discussion products • Continuous monitoring of satellite signatures for heavy/excessive • precipitation.
Hydroestimator Products at NESDIS • Every 15 Minutes: • Instantaneous Rate • 1 hour totals • 3 hour totals • 6 hour totals • Daily (12Z): • 24 hour totals
Factors in Derivation of HYDROESTIMATES • 15 min imagery • Cloud top temperature • Original AE…Radar reflectivity for rain/no rain • Hydro-Estimator (Auto SPE on AWIPS)…no radar - uses satellite-based screening technique • Moisture correction – (Precipitable Water and RH) • Orographic correction • Warm cloud tops/equilibrium level adjustment • Parallax (satellite viewing angle)
Click on “NCEP/Hydro” on Menu Bar To Access the Pull Down Menu 1 hr Auto SPE Manual SPE Example of AWIPS Hydro-Estimator graphic, Called “1 hr Auto Satellite Precip Estimates” (SPE)
Hydro-Estimator vs. Manual IFFA • Manual IFFA (Interactive Flash Flood Analyzer): • Satellite-derived Precip Estimates determined by satellite meteorologist • - Uses cloud toptemp, PWxRH, warm top correction, etc, experience, • cloud top temp change and growth, cell mergers, and rain burst. • Computer (McIDAS) stores and totals estimates • Automated Hydroestimator: • Satellite-derived Precip Estimates determined by computer (algorithm) • - Uses cloud top temp, PW&RH, warm top correction, etc • - Does not usecloud top temp change and growth, cell mergers, or rain • burst.
Web Sites for NESDIS Satellite Estimates • Satellite Services Division (SSD) Home Page - SAB Operational Products • http://www.ssd.noaa.gov/PS/PCPN - Satellite Precipitation Estimate Messages (SPENES) • Satellite Precipitation Estimate graphics and/or Annotated SPENES graphics • Center for Satellite Applications and Research (STAR) Flash Flood Home Page - Multi-hour Hydro-Estimator Products • http://www.orbit.nesdis.noaa.gov/smcd/emb/ff/