Download
1 / 13
130 likes | 222 Views
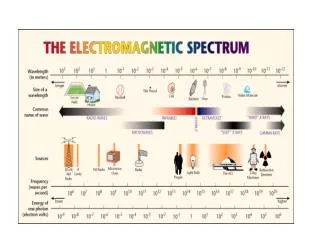
Activity: Emission spectroscopy and smart sensors. What is a Smart Sensor?.

E N D
What is a Smart Sensor? • We will use the term “Smart Sensor” to refer to systems that employs a sensor device mated to microelectronics. In this activity we will use a light emitter and a spectrometer for our sensor system and a computer will take the place of the microelectronics. The system used in this activity is not engineered to minimize size and power consumption but clearly those would be goals in any widely deployed commercial device.
Preparation for Activity • Items Needed: Ocean Optics Red Tide USB 650 Spectrometer, optical fiber lead for spectrometer, Computer with Ocean Optics Spectra Suite. Laser pointer light sources red, green; other light sources. • An understanding of various emission light sources
Instructor To initiate the activity discuss the emission of light from a laser pointer-lead students into a discussion of some of the principles of solid state lasers. Be prepared to discuss some of the major ideas behind solid state lasers and simulated emission. Read sections on quantum effects and the laboratory on emission spectroscopy
Safety Consideration WARNING: The output of the solid state lasers in laser pointers and other devices is potentially dangerous and one needs to insure that the light is not directed into the eyes of students, graduate assistants or faculty members
A Red Tide USB650 spectrometer system A “Red Tide” CCD detector based spectrometer, A CCD is an acronym for a charge coupled device: Here a linear array of silicon sensors that responds to light. In the spectrometer light is broken down into component wavelengths by an interferometer and the output at each wavelength sensed by the CCD sensor. The spectrometer covers the wavelength range 350 nm to 1000 nm.
Optical fiber End on view of the optical fiber showing glass interior. Optical fibers for the Rid Tide 650 can be obtained for a variety of wavelength ranges.
A Red Tide USB650 spectrometer system with USB link and optical fiber attached A “Red Tide” spectrometer connected to an optical fiber(red/blue) and a USB computer interface (clay ). The USB link is used to bring power the spectrometer and transmit data to the computer. Light is brought to the spectrometer using the optical fiber.
Experimental Direct the output of the laser to the open end of the optical fiber. It is useful to have the fiber and light source well secured so that experiments testing smart sensor designs can be easily carried out.
Questions • What observations can you make concerning the nature of the red and green laser spectra? • What problems do you see in the design of this activity? What improvements would you make? • What other kinds of measurements can you see being carried out with this system both indoors and out.
Design • Based on your observations during this activity design smart sensor systems for two different tasks. • What would be necessary to build a smart sensor system ( somewhat like the system discussed in this activity) capable of detecting a specific airborne chemical.