Download
1 / 22
220 likes | 327 Views
SUSTAINABLE GOLF COURSE MANAGEMENT 2008 MONITORING PROGRAMME. Dr Stephen Baker Sports Turf Research Institute, UK. DGB WORKING GROUP. Six courses Twenty greens (good, medium, poor) Sustainable management-reduced fertiliser, irrigation, pesticides, fungicides Regular over-sowing with Festuca.

E N D
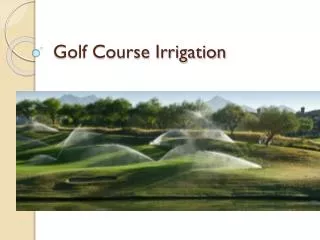
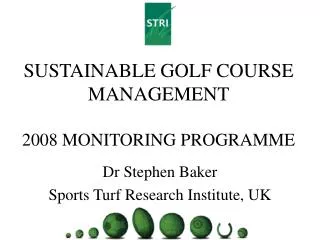
SUSTAINABLE GOLF COURSE MANAGEMENT2008 MONITORING PROGRAMME Dr Stephen Baker Sports Turf Research Institute, UK
DGB WORKING GROUP • Six courses • Twenty greens (good, medium, poor) • Sustainable management-reduced fertiliser, irrigation, pesticides, fungicides • Regular over-sowing with Festuca
INFORMATION • DGB data base • Management inputs • STRI visit September 2008
DGB data base INFORMATION • Good at picking up changes during the year • Good records at some sites • Danger of some variation because of different operators • Considerable amounts of missing data Management inputs • Generally good records available STRI visit • Consistency in data collection • Good for recording factors that change slowly • Very poor for seasonal trends
DATA ANALYSED DGB DATABASE • Sward factors – species composition, thatch depth • Soil Properties – infiltration rate, pH, CEC • Playing quality – Stimpmeter, Turf thumper • Disease and pests • Management inputs – nutrients, aeration, overseeding, etc
DATA ANALYSED STRI September visit • Grass cover and species composition • Organic matter content • pH, P, K, Mg, Ca • Soil water content
GRASS SPECIES Dormant grasses • Festuca - 14 greens • Agrostis - 5 greens • Poa annua - 1 green Overall 60 % Festuca 28% Agrostis 12% Poa annua
PROPERTY UNITS MEAN ALL CLUBS IQR+ RANGE Grass properties Total cover % 93 90 - 95 88 - 95 Festuca % 60 37 - 82 17 - 98 Agrostis % 28 15 - 39 0 - 57 Poa annua % 12 3 - 19 1 - 45
PROPERTY UNITS MEAN ALL CLUBS IQR+ RANGE Root depth - Main mm 86 69 - 99 63 - 127 - Max mm 186 171 - 211 86 - 238
PROPERTY UNITS MEAN ALL CLUBS IQR+ RANGE Soil properties Infiltration rate mm/h 244 126 - 225 43 - 806 0-20 mm Organic matter % 6.2 5.20 - 6.90 2.9 - 12.0 20-40 mm % 4.5 3.38 - 5.55 2.8 - 6.9 40-60 mm % 3.3 2.80 - 3.78 1.4 - 5.7 60-80 mm % 2.6 2.08 - 3.15 1.4 - 5.7
PROPERTY UNITS MEAN ALL CLUBS IQR+ RANGE pH (1:1 CaCl2) 5.3 5.2 - 5.4 4.0 - 7.0 P mg/l 24 20 - 28 9 - 46 K mg/l 83 53 - 99 30 - 193 Mg mg/l 60 39 - 76 22 - 149 Ca mg/l 277 91 - 325 65 - 1000
PROPERTY UNITS MEAN ALL CLUBS IQR+ RANGE Chemical input Total N kg/ha 85 70 - 101 56 - 123 Total P kg/ha 24 16 - 25 12 - 17 Total K kg/ha 137 82 - 158 52 - 266 Iron sulphate kg/ha 29 7 - 46 0 - 69
PROPERTY UNITS MEAN ALL CLUBS IQR+ RANGE Playing quality Stimpmeter: Apr-Sept Feet 7.0 6.4 - 7.5 6.1 - 8.1
Depth Recommended limits Mean Number of cases exceeding limit (out of twenty sets of core data) ORGANIC MATTER CONTENT 0-20 mm 7.5% 6.2 % 4 20-40 mm 5.5% 4.5 % 5 40-60 mm 4.5% 3.3 % 3 60-80 mm 3.0% 2.6 % 6
COMPARISON OF MEASURED VALUES FOR THE BEST, INTERMEDIATE AND WORST GREENS FROM EACH OF THE SIX COURSES Parameter Green type Good Intermediate Poor Species composition (%) Festuca 62 65 46 Agrostis 30 24 34 Poa 7 11 21 Total cover 92 93 93 Depth of main root system (mm) 88 87 76 Maximum root length (mm) 192 194 163 Organic matter content (%) 0-20 mm 5.7 5.9 6.7 Green speed (feet) (Apr-Sept) 7.01 6.87 6.86 No Consistent effects of pH, nutrient content or organic matter at depth
Festuca content Agrostis content Poa annua content Positive 0.53 pH (water) 0.66 Organic matter 0.74 Organic matter 0.71 Max. root depth Negative – 0.78 Organic matter –0.74 pH (water) CORRELATION COEFFICIENTS FOR SELECTED INDICATORS OF GREEN PERFORMANCE AND SOIL AND MANAGEMENT PROPERTIES
ROOT DEPTH – MAIN ROOT MASS ROOT DEPTH – MAXIMUM LENGTH Positive 0.67 Mowing height 0.46 Phosphate application 0.62 Potassium application 0.71 Festuca Negative –0.49 pH (CaCl2) –0.57 Water content (surface) –0.50 Organic matter (40-60 mm) –0.54 Water content (60 mm) –0.47 Organic matter content –0.50 Irrigation amount –0.50 Overseeding –0.56 Agrostis –0.47 Poa annua
GREEN SPEED (APRIL-SEPTEMBER) Positive 0.53 pH (CaCl2) 0.47 Calcium content 0.57 Root depth 0.53 Festuca content Negative –0.48 Water content (surface) –0.60 Organic matter (surface) –0.58 Irrigation amount –0.60 Vertical mowing frequency –0.65 Iron sulphate application –0.57 Agrostis content
TEMPORAL TRENDS • No attempt to assess changes over time at this early stage • Full data sets are needed, especially for factors such as green speed, hardness, disease and pests.
KEY PARAMETERSIN RELATION TO RESOURCES AVAILABLE • Species composition, disease, pests, green speed, root length, water content, chemical properties, management programme • Firmness (ideally) Method • Water infiltration rates?
St Ives Estate, Bingley, West Yorkshire BD16 1AU Tel (+44) 01274 565131 Fax (+44) 01274 561891 email: info@stri.co.uk www.stri.co.uk