Download
1 / 49
490 likes | 595 Views
Visualizing RNA Expression Data. John Quackenbush VIZBI 16 March 2011. Northern Blots: Before the dawn of Time. Northern Blots. Northern Blots. Quantitative RT-PCR The Pre-Modern Era. Quantitative PCR. Quantitative PCR and other Methods. Large-scale Quantitative RT-PCR:

E N D
Visualizing RNA Expression Data John Quackenbush VIZBI 16 March 2011
Northern Blots: Before the dawn of Time
Quantitative RT-PCR The Pre-Modern Era
Large-scale Quantitative RT-PCR: The Dawn of the Modern Age
Our World Today: A Microarray Overview
History is written by the victors (or those who produce software): The Birth of Clustering This was also the start of tormenting the red-green color-blind.
Truth is determined by the person giving the talk: MeV is the best clustering tool ever! http://www.tm4.org
Truth is determined by the person giving the talk: MeV is the best clustering tool ever!
Truth is determined by the person giving the talk: MeV is the best clustering tool ever!
Public Microarray Data ArrayExpress 20,423 Experiments (572,682 hybs/arrays) GEO 21,320 Experiments (529,108 arrays) CIBEX 148 Experiments (2,711 arrays) SMD 21,521Expts (80,319 incl private data)
>1,000,000 arrays x $500 = $500,000,000 Cancer Studies account for >14% of all studies in databases…
Disease Progression and Personalized Care Birth Treatment Death Quality Of Life Natural History of Disease Clinical Care Environment + Lifestyle Outcomes Treatment Options Disease Staging Patient Stratification Early Detection Genetic Risk Biomarkers
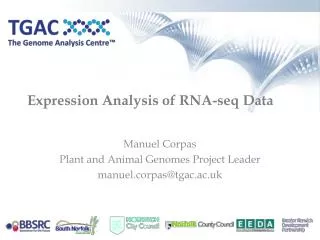
Welcome to the post-Modern World: Next-Gen Technologies have Dramatically Expanded our Genomic Universe
Back to Excel, Man’s Best Friend RNA-Seq data of 7 FFPE blocks
Cells Converge to Attractive States • Stuart Kauffman presented the idea of a gene expression landscape with attractors • ~250 stable cell types each represent attractors • Cells can be "pushed" or induced to converge to an attractor. • Once in the attractor, a cell is robust to small perturbations. Jess Mar
Differentiation of Promyelocytes into Neutrophil-Like Cells Affymetrix GeneChip Time 0 Promyeloctyes (HL-60 Cell Line) RA used in differentiation therapy for acute promyelocytic leukemia. ~6 days DimethylSulfoxide (DMSO) All-Trans Retinoic Acid (ATRA) Combined with chemotherapy, complete remission rates as high as 90-95% can be achieved. Neutrophil-like Cells Day 7 Huang et al. PRL 2005 Collins et al. PNAS 1978 Jess Mar
DMSO, ATRA GEDI: Cells Display Divergent Trajectories That Eventually Converge as they Differentiate Graphical representation of the results from a Self-Organizing Map clustering. Expression data from a single sample (time point) clustered according to a grid. What factors drive this divergent-then-convergent behavior? Huang et al. PRL 2005
Our Hypothesis Observed Trajectory (Perturbation 1) State A State B Observed Trajectory (Perturbation 2) Transient Pathway (Perturbation 1) State A Core Differentiation Pathway State B Transient Pathway (Perturbation 2) Jess Mar
Observed Trajectory 4 hrs 8 hrs 12 hrs 18 hrs 1 day 2 hrs ATRA ATRA DMSO DMSO ATRA ATRA DMSO DMSO 2 days 3 days 4 days 5 days 6 days 7 days Jess Mar
Transient Trajectory 4 hrs 8 hrs 12 hrs 18 hrs 1 day 2 hrs ATRA DMSO ATRA DMSO 2 days 3 days 4 days 5 days 6 days 7 days Jess Mar
Core Trajectory 4 hrs 8 hrs 12 hrs 18 hrs 1 day 2 hrs ATRA DMSO ATRA DMSO 2 days 3 days 4 days 5 days 6 days 7 days Jess Mar
Extracellular Membrane Cytoplasm Nuclear high variance low variance Ultimately, we’d like to get to pathways:Functional Roles Are Associated with Constraint High-variance genes tend to function as cell surface receptors. Low-variance genes function as kinases and transferases.
SZ Group PD Group P-value 2.5 10-4 P-value 2.8 10-7 Density Density Node Degree Node Degree Control Group P-value 3.5 10-4 Density high variance low variance Variance Constraints Alter Network Topology Degree distributions for the MAPK module are significantly different (Kolmogorov-Smirnov test). Degree of statistical significance is altered by disease status.
So we’re back to Heat Maps The transcriptional profiles of ONS XS cells from SZ patients more closely resemble those of healthy fibroblasts than any other stem cell signature.
And of course, we’ve left out the interestingg stuff, like where genes are expressed.
PAGE DETAILS • Search • Facets • Search within results • Keyword prompts • Search history • Table: • Paged results • Sortable columns • Actions: • Go to Gene detail page • Add genes to ‘gene set’
PAGE DETAILS • Annotation summary & summary view for each assay/data type: • Accordion style sections • GEXP – expression profile across major Dx categories • RNASeq – Exon structure of the gene • SNPs – Table of SNPs in region of gene, highlighting association with major Dx group • - Methylation – Methylation profile in region around gene • Genomic alterations – table of CNVs & alterations observed w/ freq in region around gene • Actions: • - Click through to assay detail page • Add gene to set Annotation Summary Gene Expression Summary RNASeq
PAGE DETAILS • - View aggregate statistics • View cohort details • Build cohort sets • Build composite phenotypes • Actions: • -Go to data download for selected cohort • Go to assay detail for selected cohort • Go to cohort manager
Analysis Tools • PAGE DETAILS • Very minimal parameters and options…here just 2 cohorts of interest, maybe p-value cutoff • Generates comprehensive report • Edit in place results – Don’t set parameters, edit the results • Analysis goes into queue, email notification when finished Cohort 1: Set 1 Cohort 2: Set 2 Job name: My job 1 Start Analysis View analysis parameters Job Status Running
Analysis of Differential Expression: My Job 1 • PAGE DETAILS • Very minimal parameters and options. • Generates comprehensive report • Edit in place results – Don’t set parameters, edit the results • Accordion style result sections • Generate PDF report of analysis • Analysis goes into queue, email notification when finished Supervised Analysis Meta analysis Unsupervised analysis
Before I came here I was confused about this subject. After listening to your lecture, I am still confused but at a higher level. - Enrico Fermi, (1901-1954)
Acknowledgments <johnq@jimmy.harvard.edu> The Gene Index Team Corina Antonescu Valentin Antonescu Fenglong Liu Geo Pertea Razvan Sultana John Quackenbush Center for Cancer Computational Biology Mick Correll HowieGoodell Kristina Holton Jerry Papenhausen Patricia Papastamos John Quackenbush http://cccb.dfci.harvard.edu Microarray Expression Team Stefan Bentink Thomas Chittenden Aedin Culhane Kristina Holton Jane Pak Renee Rubio Array Software Hit Team Katie Franklin Eleanor Howe Sarita Nair Jerry Papenhausen John Quackenbush Dan Schlauch RaktimSinha Joseph White (Former) Stellar Students Martin Aryee Kaveh Maghsoudi Jess Mar Systems Support Stas Alekseev, Sys Admin Eskitis Institute Christine Wells Alan Mackay-Sim Assistant Joan Coraccio Juliana Coraccio http://compbio.dfci.harvard.edu