Download
1 / 59
590 likes | 678 Views
And the children in the apple tree Further poetic findings from the Union County Longitudinal Study 2007-2013. 2006-2013. Quality care and a smooth transition to Kindergarten have been identified as important in retaining the benefits of early education .

E N D
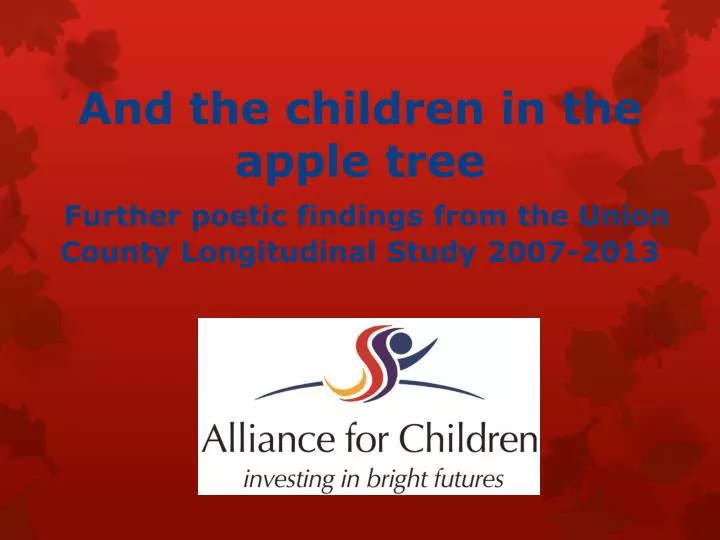
And the children in the apple treeFurther poetic findings from the Union County Longitudinal Study 2007-2013 2006-2013
Quality care and a smooth transition to Kindergarten have been identified as important in retaining the benefits of early education. • What we have seen in Union County is a demonstration that early education and support for a child’s transition to public schooling are related to “on-grade-level” proficiency in literacy at third grade and beyond.
Theoretical Model School Success
The results from analysis of previous cohorts of children have shown extended benefits from participation in quality ECE for all children regardless of SES. • This finding has now been replicated in other studies within the state with students from similar family and educational experiences.
2012-13 • Cohort V follow-up in Kindergarten Study Timeline
Aggregated Analysis • Data for 1371 students (1250 were resident in Union Co. as 4-yr. olds) • Cohort 1= 647/446 • Cohort 2= 337/234 • Cohort 3= 394/273 • Follow-up response at 3rd Grade of 69.51% (953/1371)
ECE Program Distribution Cohorts I-III Frequency Percent No Care 366 29.3 Faith Based 184 14.7 Headstart 58 4.6 More at Four/Title 1 281 22.5 Private 214 17.1 Unknown 139 11.1 repeated kindergarten 8 .6 Total 1250 100.0
Effects of ECE Participation On Reading Level Through 3rd Grade for Aggregated Cohorts I thru III N=953 Chi square= 4.54, d.f.=1, Sig.=.033 % At or Above Grade Level 12
Effects of ECE Participation On Math Level Through 3rd Grade for Aggregated Cohorts I thru III N= 784 Chi square= 0.84, d.f.=1, Sig.=.771 % At or Above Grade Level 13
Effects of ECE Participation on Mathematics Level Through 3rd Grade for Aggregated Cohorts I thru III N=784 Chi square= .009, d.f.=1, Sig.=.510 % At or Above Grade Level 14
Ethnicity and On-Grade Level Performance at Grade 3 N= 784 Math, 953 Reading
ECE On-Grade Level Effect for Reading by Ethnicity- All N= 953, Chi Square= 95.53, d.f.= 3, sig.= .000
ECE On-Grade Level Effect for Math by Ethnicity- All N= 784, Chi Square= 80.82, d.f.= 3, sig.= .000
ECE On-Grade Level Effect for Math by Ethnicity- Title 1 Schools N= 953, Chi Square= , d.f.= 3, sig.= .000
ECE On-Grade Level Effect for Reading by Ethnicity- Title 1 Schools N= 718, Chi Square= , d.f.= 3, sig.= .000
Effect of Ease of Social Transition on Math Performance at End of 3rd Grade (aggregated) % on Grade Level in Math N= 918 Chi Square = 13.91, d.f.= 2, Sig.= .001
Effect of Ease of School Routine Transition on Reading Performance at End of 3rd Grade (aggregated) % on Grade Level in Rdg N= 927 Chi Square = 13.05, d.f.= 2, Sig.= .001
Effect of Ease of Literacy Transition on Reading Performance at End of 3rd Grade (aggregated) % on Grade Level in Rdg N= 921 Chi Square = 52.78, d.f.= 2, Sig.= .000
Effect of Ease of Overall Child Transition on Reading Performance at End of 3rd Grade (aggregated) % on Grade Level in Rdg N= 920 Chi Square = 23.82, d.f.= 2, Sig.= .000
Effect of Ease of Parent Transition on Reading Performance at End of 3rd Grade (aggregated) % on Grade Level in Rdg N= 933 Chi Square = 2.69, d.f.= 2, Sig.= .260
Effect of Ease of Social Transition on Math Performance at End of 3rd Grade (aggregated) % on Grade Level in Math N= 760 Chi Square = 19.46, d.f.= 2, Sig.= .000
Effect of Ease of School Routine Transition on Math Performance at End of 3rd Grade (aggregated) % on Grade Level in Math N= 767 Chi Square = 15.41, d.f.= 2, Sig.= .000
Effect of Ease of Literacy Transition on Math Performance at End of 3rd Grade (aggregated) % on Grade Level in Math N= 765 Chi Square = 63.81, d.f.= 2, Sig.= .000
Effect of Ease of Overall Child Transition on Math Performance at End of 3rd Grade (aggregated) % on Grade Level in Math N= 763 Chi Square = 38.85, d.f.= 2, Sig.= .000
Effect of Ease of Parent Transition on Math Performance at End of 3rd Grade (aggregated) % on Grade Level in Math N= 770 Chi Square = 5.05, d.f.= 2, Sig.= .080
Effect of Family Participation in Kindergarten Transition on Reading at the End of 3rd Grade (aggregated) % on Grade Level N= 914, chi square = 13.372, d.f.= 2, sig.= .001
Effect of Family Participation in Kindergarten Transition on Math at the End of 3rd Grade (aggregated) % on Grade Level N= 752, chi square = 18.943, d.f.= 2, sig.= .000
Transition and Reading Success Higher levels of family involvement in transition activities “Smooth transitions” in social, school routine, and academic skills Support in transition from the ECE program.
Effect of ECE Help in Kindergarten Transition on Reading at End of 3rd Grade (Cohorts I-III)) % on Grade Level N= 779, Chi Square = 20.528, d.f.= 1, Sig.= .000
Effect of ECE Help in Kindergarten Transition on Mathematics at End of 3rd Grade (Cohorts I-III)) % on Grade Level N= 655, Chi Square = 10.426, d.f.= 1, Sig.= .001
Trends in Center Star Ratings and Faculty/Staff Education in Union County 2006-2012
Improvements Over Time2006-2012 Increased average education levels of lead teachers and other staff in child care centers Increased average star-ratings of child care facilities between 2006 and 2010 Increased average kindergarten readiness screening scores for children attending ECE [Cohorts I-IV] Increased average scores on end of year K-2 assessments for children attending ECE [Cohorts I-IV] 38
Poster Sessions From research to action: Policy Implications Methods and Comparisons: Winston-Salem/Forsyth County Schools, The Enduring Impact of PreK
Cohort V • 228 four-year olds recruited during 2011-12. • Objective to link early development history and a more complete history of ECE to subsequent school transition and achievement. • Of those that responded, over half said that they had heard of the Alliance for Children and 42% said that they or their child had participated in Alliance supported activities.
Cohort 5 Ethnicity • Hispanic students make up almost half of the sample. N=204
Gender • There are more boys than girls in the sample.
Family Income showed a bi-modal distribution with 20% of responding “Don’t Know”
Over half the sample have attended or graduated from college level programs.
ECE About a 30% of 2-3 yr. olds in the cohort were in center or family care while over 90% were enrolled in care as 4 yr. olds. The modal number of hours attending ECE per week at age 4 was 30-32 hrs.
ASQ and Transition Analysis conducted thus far has shown a significant correlations between ASQ score fine motor and personal/social skills with both literacy and school routine transition in kindergarten. The strength of these correlations are moderately strong.
ASQ and Transition Parents’ ratings of their child’s readiness for kindergarten was significantly correlated with overall ease of transition and in literacy skills and school routine.
Kindergarten Teacher Survey Reported ECE Participation in Transition N=49