Download
1 / 48
480 likes | 561 Views
Temporal Relationship Among Clusters for Data Streams. Margaret H. Dunham, Michael Hahsler, Doug Raiford Students: Yu Meng , Donya Quick, Jie Huang, Charlie Isaksson, Mallik Kotamarti CSE Department Southern Methodist University Dallas, Texas 75275 mhd@lyle.smu.edu

E N D
Temporal Relationship Among Clusters for Data Streams Margaret H. Dunham, Michael Hahsler, Doug Raiford Students: Yu Meng, Donya Quick, Jie Huang, Charlie Isaksson, Mallik Kotamarti CSE Department Southern Methodist University Dallas, Texas 75275 mhd@lyle.smu.edu This material is based upon work supported by the National Science Foundation under Grant No IIS-0948893.
Objectives/Outline Traditional Clustering of Data Streams Ignores one of the most Salient Features of Streams: Ordering • Introduction • Background • TRAC-DS • TRAC-DS Applications • Conclusions/Future Work
Objectives/Outline • Introduction • Stream Data • Motivation • Background • TRAC-DS • TRAC-DS Applications • Conclusions/Future Work
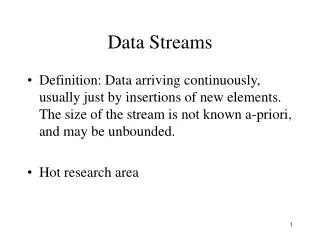
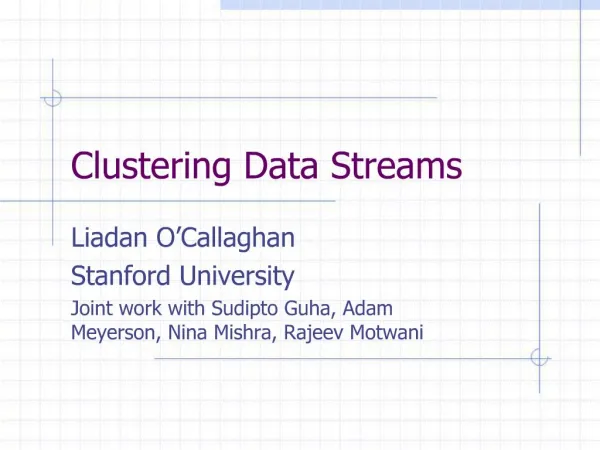
Stream Data • A growing number of applications generate streams of data. • Computer network monitoring data • Call detail records in telecommunications • Highway transportation traffic data • Online web purchase log records • Sensor network data • Stock exchange, transactions in retail chains, ATM operations in banks, credit card transactions. • Clustering techniques play a key role in modeling and analyzing this data.
Stream Data Format • Events arriving in a stream • At any time, t, we can view the state of the problem as represented by a vector of n numeric values: Vt = <S1t, S2t, ..., Snt> Time
Data Stream Modeling • Single pass: Each record is examined at most once • Bounded storage: Limited Memory for storing synopsis • Real-time: Per record processing time must be low • Summarization (Synopsis )of data • Use data NOT SAMPLE • Temporal and Spatial • Dynamic • Continuous (infinite stream) • Learn • Forget • Sublinear growth rate - Clustering 6
Motivation • Temporal Ordering is a major feature of stream data. • Many stream applications depend on this ordering • Prediction of future values • Anomaly (rare event) detection • Concept drift
Objectives/Outline • Introduction • Background • Clustering Stream Data • Extensible Markov Model - EMM • TRAC-DS • TRAC-DS Applications • Conclusions/Future Work
Stream Clustering Requirements • Dynamic updating of the clusters • Identify outliers • Barbara [2]: • compactness • fast • incremental processing
Stream Clustering Algorithms • LOCALSEARCH [4] • Partitions stream into segments • Clusters each segment individually by solving the k-medians problem • Iteratively reclusters the resulting centers • CluStream [1] • Micro-clusters represented by summary statistics. • Micro-clusters are handled online • Micro-clusters merged offline • MONIC [13] • Evolution of clusters over time • Cluster transitions over time
MM A first order Markov Chain is a finite or countably infinite sequence of events {E1, E2, … } over discrete time points, where Pij = P(Ej | Ei), and at any time the future behavior of the process is based solely on the current state A Markov Model (MM) is a graph with m vertices or states, S, and directed arcs, A, such that: • S ={N1,N2, …, Nm}, and • A = {Lij | i 1, 2, …, m, j 1, 2, …, m} and Each arc, Lij = <Ni,Nj> is labeled with a transition probability Pij = P(Nj | Ni).
Extensible Markov Model (EMM) • Time Varying Discrete First Order Markov Model • Nodes are clusters of real world states. • Learning continues during application phase. • Learning: • Transition probabilities between states(clusters) • Statelabels (Cluster summary) • State are modified as clusters are
2/3 1/2 N3 2/3 N1 2/3 1/2 N3 1/3 1/1 N2 N1 N1 1/2 2/3 1/3 1/1 N2 1/3 N2 N1 1/3 N2 N3 1/1 1 N1 1/1 2/2 1/1 N1 EMM for TRAC-DS Modeling <18,10,3,3,1,0,0> <17,10,2,3,1,0,0> <16,9,2,3,1,0,0> <14,8,2,3,1,0,0> <14,8,2,3,0,0,0> <18,10,3,3,1,1,0.>
Objectives/Outline • Introduction • Background • TRAC-DS • Definition • Relationship to Traditional Clustering • Operations • TRAC-DS Applications • Conclusions/Future Work
TRAC-DS NOTE • TRAC-DS is not: • Another stream clustering algorithm • TRAC-DS is: • A new way of looking at clustering • Built on top of an existing clustering algorithm • TRAC-DS may be used with any stream clustering algorithm
Data Stream Clustering • At each point in time a data stream clustering ζ is a partitioning of D', the data seen thus far. • Instead of the whole partitions C1, C2,..., Ck only synopses Cc1,Cc2,...,Cck are available and k is allowed to change over time. • The summaries Cci with i =1, 2,...,k typically contain information about the size, distribution and location of the data points in Ci.
TRAC-DS Definition Given a data stream clustering ζ, a temporal relationship among clusters (TRAC-DS) overlays a data stream clustering ζ with a EMM M, in such a way that the following are satisfied: (1) There is a one-to-one correspondence between the clusters in ζ and the states S in M. (2) A transition aij in the EMM M represents the probability that given a data point in cluster i, the next data point in the data stream will belong to cluster j with i; j = 1; 2; : : : ; k. (3) The EMM M is created online together with the data stream clustering
Clustering Operations A clustering operation is a function q : ζ × x → ζ which is used by the data stream clustering algorithm to update the clustering ζ given some additional information x which either is a new data point or other information (e.g., the number of the cluster to be deleted to be simplified the clustering).
TRAC-DS Operations • A TRAC-DS operation is a function r : M × sc × y → M × sc that updates the temporal relationship among clusters represented by the EMM M with states S given a current state sc ∈ S and additional information y and returns an updated EMM and possibly a new current state. • In order to be able to dynamically update the EMM M we need to store a transition count matrix C. The count cij in C contains the number of times we observed a new point being assigned by the clustering algorithm to cluster i followed by a point being assigned to cluster j.
Stream Clustering Operations * • qassign point(ζ,x): Assigns the new data point x to an existing cluster. • qnew cluster(ζ,x): Create a new cluster. • qremove cluster(ζ,x): Removes a cluster. Here x is the cluster, i, to be removed. In this case the associated summary Cci is removed from ζ and k is decremented by one. • qmerge clusters(ζ,x): Merges two clusters. • qfade clusters(ζ,x): Fades the cluster structure. • qsplit clusters(ζ,x): Splits a cluster. * Inspired by MONIC [?]
TRAC-DS Operations • rassign point(M,sc,y): Assigns the new data point to the state representing an existing cluster • rnew cluster(M,sc,y): Create a state for a new cluster. • rremove cluster(M,sc,y): Removes state. • rmerge clusters(M,sc,y): Merges two states. • rfade clusters(M,sc,y): Fades the transition probabilities using an exponential decay f(t)=2−λt • rsplit clusters(M,sc,y): Splits states. Y clustering operations.
TRAC-DS Advantages • Dynamic • Flexible – • Use any Clustering Algorithm • Supports and clustering operations • Scalable • Merges Clustering & Markov Modeling
Objectives/Outline • Introduction • Background: • TRAC-DS • TRAC-DS Applications • Anomaly Detection • Bioinformatics • Conclusions/Future Work
What is Anomaly in Stream Data? • Rare - Anomalous – Surprising • Out of the ordinary • Not outlier detection • No knowledge of data distribution • Data is not static • Must take temporal and spatial values into account • May be interested in sequence of events • Ex: Snow in upstate New York is not an anomaly • Snow in upstate New York in June is rare • Rare events may change over time
TRAC-DS Approach to Detect Anomalies • By learning what is normal, the model can predict what is not • Normal is based on likelihood of occurrence • Use TRAC-DS to build clusters and behavior between clusters • We view a rare event as: • Unusual event • Transition between events states which does not frequently occur. • Continue learning
Determining Rare • Occurrence Frequency (OFi) of an EMM state Si is normalized count of state: • Normalized Transition Probability (NTPmn), from one state, Sm, to another, Sn, is a normalized transition Count:
Datasets/Anomalies • MnDot – Minnesota Department of Transportation • Automobile Accident • Ouse and Serwent – River flow data from England • Flood • Drought • KDD Cup 1999 & 2000 http://kdd.ics.uci.edu/databases/kddcup99/kddcup99.html • Intrusion • Cisco VoIP – VoIP traffic data obtained at Cisco • Unusual Phone Call
EMM Sublinear Growth Servent Data
TRAC-DA Rare Event Detection Detected unusual weekend traffic pattern Weekdays Weekend Minnesota DOT Traffic Data
TRAC-DS Intrusion Detection • DARPA 1999/2000 • Synthetic Dataset • MIT Lincoln Lab • The DARPA 1999 dataset which is free of attacks for two weeks (1st week and 3rd week) is used as training data • DARPA 2000 dataset which contains DDoS attacks is used a test data.
Table 8. EMM detection and false positive rates. TRAC-DS Intrusion Detection
TRAC-DS & Bioinformatics • Analysis DNA/RNA Sequences • Applications: • Classification • Differentiation • 16s RNA • 1542 ntrRNA • Highly conserved across species • miRNA • Short (20-25nt) sequence of noncoding RNA • Known since 1993 but significance not widely appreciated until 2001 • Impact / Prevent translation of mRNA
acgtgcacgtaactgattccggaaccaaatgtgcccacgtcga Moving Window First – Convert Sequence to NSV A C G T Pos 0-8 2 3 3 1 Pos 1-9 1 3 3 2 … Pos 34-42 2 4 2 1
TRAC-DS PredictionwithmiRNA • Positive Data Model • Cutoff Probability = 0.3 • False Positive Rate = 0% • True Positive Rate = 66% • Test results could be improved by meta classifiers combining multiple positive and negative classifiers together.
Profile EMMs • Examples of three different Profile EMMs constructed for 16S data from 3 different bacteria families
16S Classification Accuracy • Classification accuracy using different scoring metrics on 16S rRNA data from NCBI. • We learned 31 classification models (at the phylogenetic class level) from 98 organisms and tested with 23 randomly chosen organisms. • The Profile EMM approach was able to achieve classification of more than 90% after tuning the resolution settings.
TRAC-DS and Bioinformatics • Efficient • Alignment free sequence analysis • Clustering reduces size of model • Flexible • Any sequence • Applicability to Metagenomics • Scoring based on similarity between EMMs or EMM and input sequence • Applications • Classification • Differentiation
Objectives/Outline • Introduction • Background • TRAC-DS • TRAC-DS Applications • Conclusions/Future Work
TRAC-DS Ongoing/Future • Create online tool suite • Improve TRAC algorithms: • Aging • Delete state • Merge states • Split states • Apply to Image Recognition • Bioinformatics • Build Profile EMM database of NCBI 16S Bacteria Data • Perform classification using Metagenomic Data collected from Yellowstone National Park
Bibliography C. C. Aggarwal, J. Han, J. Wang, and P. S. Yu. A framework for clustering evolving data streams. Proceedings of the International Conference on Very Large Data Bases (VLDB), pp 81-92, 2003. D. Barbara, “Requirements for clustering data streams,” SIGKDD Explorations, Vol3, No 2, pp 23-27, 2002. Margaret H. Dunham, Donya Quick, Yuhang Wang, Monnie McGee, Jim Waddle, “Visualization of DNA/RNA Structure using Temporal CGRs,”Proceedings of the IEEE 6th Symposium on Bioinformatics & Bioengineering (BIBE06), October 16-18, 2006, Washington D.C. ,pp 171-178. S. Guha, A. Meyerson, N. Mishra, R. Motwani, and L. O'Callaghan, “Clustering data streams: Theory and practice,” IEEE Transactions on Knowledge and Data Engineering, Vol15, No 3, pp 515-528, 2003. Michael Hahsler and Margaret H. Dunham, “TRACDS: Temporal Relationship Among Clusters for Data Streams,” October 2009, submitted to SIAM International Conference on Data Mining. Jie Huang, Yu Meng, and Margaret H. Dunham, “Extensible Markov Model,” Proceedings IEEE ICDM Conference, November 2004, pp 371-374. Charlie Isaksson, Yu Meng, and Margaret H. Dunham, “Risk Leveling of Network Traffic Anomalies,” International Journal of Computer Science and Network Security, Vol 6, No 6, June 2006, pp 258-265. Charlie Isaksson and Margaret H. Dunham, “A Comparative Study of Outlier Detection,” July 2009, Proceedings of the IEEE MLDM Conference, pp 440-453. Mallik Kotamarti, Douglas W. Raiford, M. L. Raymer, and Margaret H. Dunham, “A Data Mining Approach to Predicting Phylum for Microbial Organisms Using Genome-Wide Sequence Data,” Proceedings of the IEEE Ninth International Conference on Bioinformatics and Bioengineering, pp 161-167, June 22-24 2009. Yu Meng and Margaret H. Dunham, “Efficient Mining of Emerging Events in a Dynamic Spatiotemporal,” Proceedings of the IEEE PAKDD Conference, April 2006, Singapore. (Also in Lecture Notes in Computer Science, Vol 3918, 2006, Springer Berlin/Heidelberg, pp 750-754.) Yu Meng and Margaret H. Dunham, “Mining Developing Trends of Dynamic Spatiotemporal Data Streams,” Journal of Computers, Vol 1, No 3, June 2006, pp 43-50. MIT Lincoln Laboratory.: DARPA Intrusion Detection Evaluation. http://www.ll.mit.edu/mission/communications/ist/corpora/ideval/index.html, (2008) M. Spiliopoulou, I. Ntoutsi, Y. Theodoridis, and R. Schult. MONIC: Modeling and monitoring cluster transitions. In Proceedings of the 12th ACM SIGKDD international conference on Knowledge discovery and data mining, Philadelphia, PA, USA, pages 706–711, 2006.