Download
1 / 16
160 likes | 295 Views
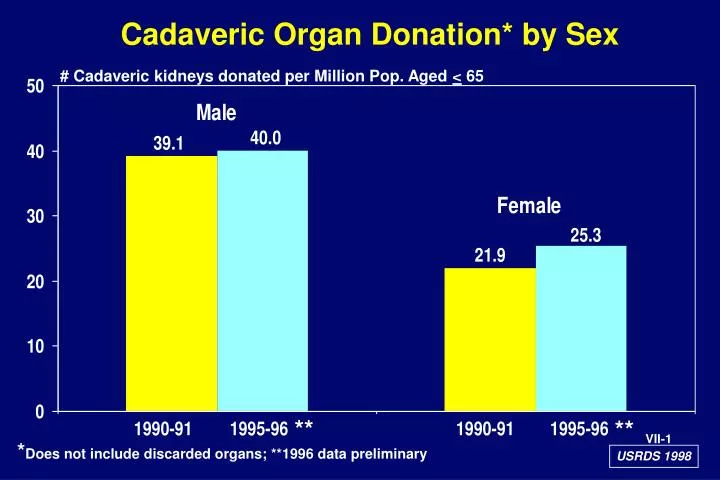
Cadaveric Organ Donation* by Sex. # Cadaveric kidneys donated per Million Pop. Aged < 65. **. **. * Does not include discarded organs; **1996 data preliminary. Number of Renal Transplants by Donor Source and Year, 1993-1996. Number of Transplants (Log Scale). 8,526 3,091 621. D =1.6%

E N D
Cadaveric Organ Donation* by Sex # Cadaveric kidneys donated per Million Pop. Aged < 65 ** ** *Does not include discarded organs; **1996 data preliminary
Number of Renal Transplants by Donor Source and Year, 1993-1996 Number of Transplants (Log Scale) 8,526 3,091 621 D =1.6% D = 5.4% D =46.6% 8,118 Cadaveric 2,639 Living Related Living Unrelated 197 Year of Transplantation D Indicates annualized percent change
First Living Donor Transplantation Counts and Rates by Recipient Age, 1996* Number of Transplants Tx per 100 Dialysis Patient Years Recipient Age Recipient Age *Preliminary; ages > 65 not shown
First Cadaveric Transplantation Counts and Rates by Recipient Age, 1996* Number of Transplants Tx per 100 Dialysis Patient Years Recipient Age Recipient Age *Preliminary; ages > 65 not shown
First Cadaveric Transplantation Rate by Age, Recipient Sex and Race, 1996* Tx per 100 Dialysis Patient Years Age 0 - 19 Age 45 - 64 Age 20 - 44 *Preliminary
First Cadaveric Transplant Rate by Network for Black Patients (Age 20-24), 1996 * Tx per 100 Dialysis Patient Years National Average *Preliminary Network Office
First Cadaveric Transplant Rate by Network for White Patients (Age 20-24), 1996 * Tx per 100 Dialysis Patient Years National Average *Preliminary Network Office
Percent of Blood Type “O” (CAD) Organs Going to “Non-O” Recipients*, 1991-96 % of Type “O” Organs ** *Excludes unknown recipient blood type **Preliminary Year of Transplantation
One-Year Patient Survival*,First Transplant by Donor Type and Year, 1986-95 Survival (%) 96.3 LD - ALL 95.4 92.6 LD - DIAB 91.3 CAD - ALL CAD - DIAB • Year of Transplantation *Adjusted for age, sex, race and cause of ESRD; **1996 followup is preliminary.
One-Year Graft Survival*, First Transplants by Donor Type and Year, 1986-1995 GraftSurvival (%) 93.0 92.0 LD - ALL 87.6 87.5 LD - DIAB CAD - ALL CAD - DIAB 1986 87 1995** 90 92 93 94 88 89 91 Year of Transplantation *Adjusted for age, sex, race, and cause of ESRD; **1996 follow is preliminary
Annual Rate of First Cadaveric Transplant Graft Loss, During First Year Post Transplant, 1985-95 Annual Rate of Graft Loss (%) 1985 1986 1987 1988 1989 1990 1991 1992 1993 1994 1995* *1996 followup is preliminary Year of Transplantation
First Living Donor Graft Survival Projections, Adjusted*, by Year of Transplantation, 1986-95 Graft Survival (%) - - - 12 Months To Last Followup Trend Extrapolated To Graft 1/2 Life Months Since First Transplant *Adjusted for age, sex, race, and cause of ESRD
First Cadaveric Graft Survival Projections, Adjusted*, by Year of Transplantation, 1986-95 Graft Survival (%) - - - 12 Months to Last Followup trend extrapolated to graft 1/2 life Months Since First Transplant *Adjusted for age, sex, race and cause of ESRD
Months to 50% Living Donor Graft Survival, Adjusted**,by Year of Transplantation, 1986-93 Months Since First Transplant * * * * Extrapolated; **Adjusted for age, sex, race and cause of ESRD; 1996 followup is preliminary Year of Transplantation
Months to 50% Cadaveric Graft Survival, Adjusted**,by Year of Transplantation, 1986-93 Months Since First Transplant * * * * Extrapolated; **Adjusted for age, sex, race and cause of ESRD; 1996 followup is preliminary Year of Transplantation
Annual Rate* of First Cadaveric Transplant Graft Loss, During Second Year Post-Transplant, 1985-94 Annual Rate of Graft Loss (%) ** Year of Transplantation *Among those with functioning graft at 1 year **1996 followup is preliminary