Download
1 / 52
520 likes | 698 Views
Ecology. IB Biology: Quarter 1 Objectives and Lecture Material. Ecology. The study of living organisms in the natural environment, how they interact with one another and how the interact with their nonliving environment. Levels of organization. atoms. species. molecules. population.

E N D
Ecology IB Biology: Quarter 1 Objectives and Lecture Material
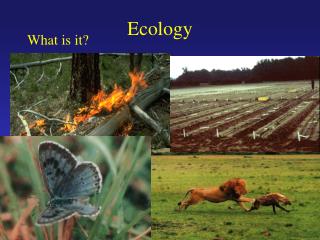
Ecology • The study of living organisms in the natural environment, how they interact with one another and how the interact with their nonliving environment
Levels of organization atoms species molecules population organelles cells community ECOLOGY tissues ecosystem organs systems biosphere organism
Species • A group of organisms that can reproduce and produce fully fertile offspring Great White Pelican Pelecanusonocrotalus
Population • A group of organism of the samespecieswhich live in the same habitat at the same timewheretheycanfreelyinterbreed • Habitat: the environment in which a species normally lives or the location of a living organism The black-veined white butterfly (Aporiacrataegi) mating
Community • All the populations of the different species living and interacting in the same ecosystem 7-spotted lady bird (Adephagiaseptempunctata) Bean aphids (Aphis fabae) Red ant (Myrmicarubra) Broom plant (Cytisusscoparius)
Ecosystem • Community (Biotic) interacting with environment (Abiotic )
Components of an Ecosystem • Biotic Factors: living or once living organisms • Abiotic Factors: nonliving factors that have an effect on living things Examples: - Water: organisms have water in their bodies (50-95%) and chemical reactions need water to happen. - Soil: type of soil determines which plants and other organisms live in that location - Light and Temperature: affect photosynthesis (plant growth is limited to amount of sunlight) Energy + CO2 + H2O → C6H12O6 + O2
Name an ecosystem you live in. List biotic and abiotic features of this ecosystem.
Using the same ecosystem, hypothesize what happens if an organism becomes extinct.
Energy and Organisms • Autotrophs: organisms which can synthesize their own complex, energy rich, organic molecules from simple inorganic molecules (e.g. green plants synthesis sugars from CO2 and H2O; bacteria in deep sea vents doing chemosynthesis) - PRODUCERS • Heterotrophs: organisms who must obtain complex, energy rich, organic compounds form the bodies of other organisms (dead or alive). • Ex: consumers and decomposers (saprotrophs and detritivores)
Decomposers • Detritivores: heterotrophic organisms who ingest dead organic matter. (e.g. earthworms, woodlice, large scavengers). Ingest first, then digest. • Saprotrophs: heterotrophic organisms who secrete digestive enzymes onto dead organism matter and absorb the digested material. (e.g. fungi, bacteria). Digest first, then absorb. Earthworm (Lumbricusterrestris) Chanterelle (Cantherelluscibarius)
Consumers • Omnivore: eats both plants and animals • Carnivore: meat eater • Herbivore: plant eater
What type of consumer are you? Why? Does your consumer label ever change?
Construct a food web containing up to 10 organisms. List what type of consumer they are.
Food Chains • Sequence of relationships between trophic levels. • Show the flow of energy from the SUN to the heterotrophs • Trophic level: an organism’s feeding position in a food chain • Producers: essential to every single food chain
Food Web • Shows the feeding relationships in a community. Arrows show the flow of energy.
Make a food web of your lunch. Include at least 10 organisms.
Read the article and generate a food web: http://ehp.niehs.nih.gov/members/2004/112-8/focus.html
What is a Trophic Level? List 4 organisms and their trophic levels. How does the energy change?
Plant material eaten by caterpillar 200 J 67 J Cellular respiration 100 J Feces 33 J Growth (new biomass) How much is available to the caterpillar’s predator?
Energy and Nutrients • Energy enters ecosystems as light and usually leaves as heat. • Nutrients do not usually enter an ecosystem and must be RECYCLED. Nutrients include: carbon, nitrogen, phosphorus, magnesium...
5.1.14 • State that saprotrophic bacteria and fungi (decomposers) recycle nutrients.
5.2.2 • Analyse the changes in concentration of atmospheric carbon dioxide using historical records. • 5.2.3 • Explain the relationship between rises in concentrations of atmospheric carbon dioxide, methane and oxides of nitrogen and the enhanced greenhouse effect.
Trophic level Dry weight (g/m2) Tertiary consumers Secondary consumers Primary consumers Primary producers 1.5 11 37 809 Biomass • Amount of dry matter in one organism • Each bar represents: dry weight of all organisms in one trophic level
5.1.10Explain the energy flow in a food chain.(Energy losses between trophic levels include material not consumed or material not assimilated, and heat loss through cell respiration.)
5.1.11State that energy transformations are never 100% efficient
5.1.13Explain that energy enters and leaves ecosystems, but nutrients must be recycled.
Populations • Characteristics: • Size: number of individuals at a certain time • Density: number of individuals in a certain space at a particular time • Spacing: clumped, uniform, random • Age Structure • Pop. Change = (birth + immigration) – (death + emigration) • Limiting factor: prevents the continuing growth of a population in an ecosystem • Can be: - water, air, light, food - diseases, competitors, predators, parasites
Population Growth • Exponential Phase: population increases exponentially because the natality rate is higher than the mortality rate. • Transitional phase: difference between natality and mortality rates are not as great, but natality is still higher so population continues to grow, but at a slower rate. • Plateau phase: natality and mortality are equal so the population size stays constant. • Carrying Capacity: the maximum population size that can be supported by the environment
5.3.2Draw and label a graph showing a sigmoid (S-shaped) population growth curve.
5.3.3Explain the reasons for the exponential growth phase, the plateau phase and the transitional phase between these two phases.
5.3.4List three factors that set limits to population increase.
The Greenhouse Effect • Light from the sun has short wavelengths and can pass through most of the atmosphere. • This sunlight warms the earth which in turn emits long wave radiation. • This long wave radiation is bounced back by the greenhouse gases, such as carbon dioxide, methane, water vapor, oxides of nitrogen and sulphur dioxide
The Greenhouse Effect • Natural and essential to life • Human pollution is making it worse = causing global warming • Oxides of nitrogen: industrial processes, burning fossil fuels, fertilizers • Methane: cattle, waste disposal, natural gas leaks • CO2: burning fossil fuels • Consequences: • Changes in climate = effects on the ecosystem • Extinction • Melting glaciers = rise in sea level • Increase in photosynthetic rates
Precautionary Principle • Action should be taken to prevent harm even if there is not sufficient data to prove that the activity will have severe consequences • If people want to do activities that may cause a change in the environment they must prove first it won’t do harm • We should take action now: reduce carbon emissions before it’s too late • Should people invest money to reduce carbon emissions if we are not 100% sure about the consequences of global warming? • More expensive to be eco-friendly • What should consumers do?
Arctic Ecosystems • North America, Greenland, Iceland, Norway, Russia • Example: polar bears/seals/algae affected • Loss of ice habitat • Increased success of pests/pathogens/mosquitoes • Increased decomposition • Expansion of temperate species/reduced range for arctic species • Rise in sea levels • Climate change • Disturbance of food chains • Melting of permafrost
5.2.5 • Evaluate the precautionary principle as a justification for strong action in response to the threats posed by the enhanced greenhouse effect.
Evolution and Ecology • 5.4 Evolution • 5.4.1 • Define evolution. • 5.4.2 • Outline the evidence for evolution provided by the fossil record, selective breeding of domesticated animals and homologous structures. • 5.4.3 • State that populations tend to produce more offspring than the environment can support. • 5.4.4 • Explain that the consequence of the potential overproduction of offspring is a struggle for survival. • 5.4.5 • State that the members of a species show variation. • 5.4.6 • Explain how sexual reproduction promotes variation in a species. • 5.4.7 • Explain how natural selection leads to evolution. • 5.4.8 • Explain two examples of evolution in response to environmental change; one must be antibiotic resistance in bacteria.
Objectives to be covered with Mississippi River Reserach • G1 Community ecology • G.1.1 • Outline the factors that affect the distribution of plant species, including temperature, water, light, soil pH, salinity and mineral nutrients. • G.1.2 • Explain the factors that affect the distribution of animal species, including temperature, water, breeding sites, food supply and territory. • G.1.3 • Describe one method of random sampling, based on quadrat methods, that is used to compare the population size of two plant or two animal species. • G.1.4 • Outline the use of a transect to correlate the distribution of plant or animal species with an abiotic variable. • G.1.5 • Explain what is meant by the niche concept, including an organism’s spatial habitat, its feeding activities and its interactions with other species. • G.1.6 • Outline the following interactions between species, giving two examples of each: competition, herbivory, predation, parasitism and mutualism. • G.1.7 • Explain the principle of competitive exclusion. • G.1.8 • Distinguish between fundamental and realized niches. • The fundamental niche of a species is the potential mode of existence, given the adaptations of the species. • The realized niche of a species is the actual mode of existence, which results from its adaptations and competition with other species. • G.1.9 • Define biomass. • G.1.10 • Describe one method for the measurement of biomass of different trophic levels in an ecosystem.
G2 Ecosystems and biomes • G.2.1 • Define gross production, net production and biomass. • G.2.2 • Calculate values for gross production and net production using the equation: gross production – respiration = net production. • G.2.3 • Discuss the difficulties of classifying organisms into trophic levels. • G.2.4 • Explain the small biomass and low numbers of organisms in higher trophic levels. • G.2.5 • Construct a pyramid of energy, given appropriate information. • G.2.6 • Distinguish between primary and secondary succession, using an example of each. • G.2.7 • Outline the changes in species diversity and production during primary succession. • G.2.8 • Explain the effects of living organisms on the abiotic environment, with reference to the changes occurring during primary succession. (Include soil development, accumulation of minerals and reduced erosion.) • G.2.9 • Distinguish between biome and biosphere. • G.2.10 • Explain how rainfall and temperature affect the distribution of biomes. • G.2.11 • Outline the characteristics of six major biomes. • (Examples of major biomes could include: desert, grassland, shrubland (chaparral, matorral, maquis and garigue, dry heathlands, fynbos), temperate deciduous forest • tropical rainforest • tundra. • The description should be limited to temperature, moisture and characteristics of vegetation.)
G3 Impacts of humans on ecosystems • G.3.1 • Calculate the Simpson diversity index for two local communities. • (D= N(N–1) Σn(n–1) • where D = diversity index, N = total number of organisms of all species found and n = number of individuals of a particular species.) • G.3.2 • Analyse the biodiversity of the two local communities using the Simpson index. • G.3.3 • Discuss reasons for the conservation of biodiversity using rainforests as an example. • G.3.4 • List three examples of the introduction of alien species that have had significant impacts on ecosystems. • (Choose one example of biological control, and one example each of accidental and deliberate release of invasive species.) • G.3.5 • Discuss the impacts of alien species on ecosystems. • (Limit the discussion to inter-specific competition, predation, species extinction and biological control of pest species, with named examples of each.) • G.3.6 • Outline one example of biological control of invasive species. • G.3.7 • Define biomagnification. • G.3.8 • Explain the cause and consequences of biomagnification, using a named example. • G.3.9 • Outline the effects of ultraviolet (UV) radiation on living tissues and biological productivity. • G.3.10 • Outline the effect of chlorofluorocarbons (CFCs) on the ozone layer. • G.3.11 • State that ozone in the stratosphere absorbs UV radiation.