Download
1 / 17
170 likes | 318 Views
Chapter 10: Graphic Illustrations. Bridging the Gap , 9/e Brenda Smith. In this chapter you will answer the questions:. What do graphics do? What is a diagram? What does a table do? What is most helpful on a typical map? What does a pie graph represent? How do you read a bar graph?

E N D
Chapter 10: Graphic Illustrations Bridging the Gap, 9/eBrenda Smith 2008 Pearson Education, Inc., publishing as Longman Publishers
In this chapter you will answer the questions: • What do graphics do? • What is a diagram? • What does a table do? • What is most helpful on a typical map? • What does a pie graph represent? • How do you read a bar graph? • What is a line graph? • What information does a flowchart convey? 2008 Pearson Education, Inc., Publishing as Longman Publishers
What Do Graphics Do? • Condense. • Clarify. • Convince. 2008 Pearson Education, Inc., Publishing as Longman Publishers
Reader’s Tip: How to Read Graphic Material • Read the title to get an overview. • Look for footnotes and read introductory material. • Read the labels. • Notice the trends and find the extremes. • Draw conclusions and formulate future exam questions. 2008 Pearson Education, Inc., Publishing as Longman Publishers
Five Kinds of Graphic Illustrations • Diagrams • Tables • Maps • Graphs • Flowcharts 2008 Pearson Education, Inc., Publishing as Longman Publishers
Diagrams • A diagram is an outline drawing or picture of an object or a process. 2008 Pearson Education, Inc., Publishing as Longman Publishers
Tables • A table is a listing of facts and figures in columns and rows for quick and easy reference. 2008 Pearson Education, Inc., Publishing as Longman Publishers
How to Read a Table • First read the title for the topic. • Then read the footnotes to judge the source. • Determine what each column represents and how they interact. 2008 Pearson Education, Inc., Publishing as Longman Publishers
Maps Traditional Maps: • Show the location of cities, waterways, sites, and roads. • Show differences in the physical terrain of specified areas. • A modern map highlights special characteristics or population distribution of a particular area. 2008 Pearson Education, Inc., Publishing as Longman Publishers
How to Read a Map • Note the title, source, and date. • Study the legend for meanings of symbols and shading. 2008 Pearson Education, Inc., Publishing as Longman Publishers
Pie Graphs • A pie graph is a circle that is divided into wedge-shaped slices. • The complete pie or circle represents a total, or 100% percent. • Each slice is a percent or fraction of that whole. 2008 Pearson Education, Inc., Publishing as Longman Publishers
Bar Graphs A Bar Graph is: • a series of horizontal or vertical bars in which the length of each bar represents a particular amount. • a series of different items which can be quickly compared by noting the different bar lengths. 2008 Pearson Education, Inc., Publishing as Longman Publishers
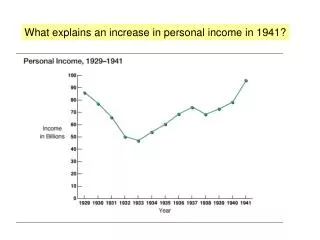
Line Graph A Line Graph is: • A continuous curve or frequency distribution in which numbers are plotted in an unbroken line. • The horizontal scale measures one aspect of the data. • The vertical line measures another aspect. • As the data fluctuate, the line will change direction and will become very jagged. 2008 Pearson Education, Inc., Publishing as Longman Publishers
Flowcharts • A flowchart shows the sequence of a set of elements and the relationships among them. • Key ideas are stated in boxes, and supporting ideas are linked by arrows. 2008 Pearson Education, Inc., Publishing as Longman Publishers
Summary Points • What do graphics do? • What is a diagram? • What does a table do? • What is most helpful on a typical map? • What does a pie graph represent? • How do you read a bar graph? • What is a line graph? • What information does a flowchart convey? 2008 Pearson Education, Inc., Publishing as Longman Publishers
Search the Net • For suggested Web sites and other research activities regarding reading graphic illustrations, go to: • http://www.ablongman.com/smith/ 2008 Pearson Education, Inc., Publishing as Longman Publishers
Vocabulary Booster • Complete the vocabulary exercises entitled “Play It Again, Sam” from your textbook. 2008 Pearson Education, Inc., Publishing as Longman Publishers