Download
1 / 20
200 likes | 350 Views
Knowing where events are going to happen. Howard A Kunst, FCAS MAAA Chief Actuary, CoreLogic Spatial Solutions. CANE – September 2014. Antitrust Notice.

E N D
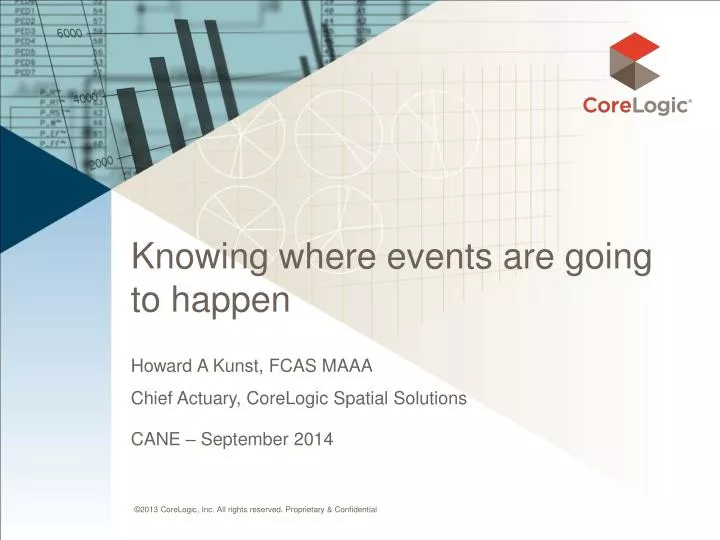
Knowing where events are going to happen Howard A Kunst, FCAS MAAA Chief Actuary, CoreLogic Spatial Solutions CANE – September 2014
Antitrust Notice The Casualty Actuarial Society is committed to adhering strictly to the letter and spirit of the antitrust laws. Seminars conducted under the auspices of the CAS are designed solely to provide a forum for the expression of various points of view on topics described in the programs or agendas for such meetings. Under no circumstances shall CAS seminars be used as a means for competing companies or firms to reach any understanding –expressed or implied – that restricts competition or in any way impairs the ability of members to exercise independent business judgment regarding matters affecting competition. It is the responsibility of all seminar participants to be aware of antitrust regulations, to prevent any written or verbal discussions that appear to violate these laws, and to adhere in every respect to the CAS antitrust compliance policy.
Session Objectives What determines the short term vs long term frequency? Geographical accuracy Models predict where the events are more likely to occur Geocoding accuracy – understanding granular data Validation of recent history of events Hail Tornado Wildfire Combination of multiple perils – Single Risk Score
Understanding where events can happen What affects the short term frequency of events? Climate change – frequency of events and geographic distribution Solar activity Heat – sunk in the earth, stored in oceans Drought conditions / Abundance of precipitation Time elapsed since last event Random variation It’s almost impossible to predict exactly when and where the next event is going to happen But if you can predict the locations with the highest risk for an event, isn’t that just as much or more important for setting a natural catastrophe plan/strategy?
Knowing where events are going to happen Scientists gather information on the both short/long term factors that increase/decrease the likelihood of natural catastrophic events Models are developed that set a risk level for every location across the US – extremely granular (10 meter grids) Revisions are made annually to adjust for more recent information (ie vegetation changes / drought conditions for Wildfires) Ongoing validation on the accuracy of the models by comparing where recent events have occurred to the estimated risk levels Do the actual events in fact occur in the higher risk areas that we expected?
The importance of granularity Parcel boundary data represents the legal extents of each taxable U.S. property address. There are an estimated 145 million privately owned parcels in the U.S. CoreLogic has converted and normalized about 140 million parcels from state, county, city, and town sources As these digital parcel boundaries become available they are rapidly being incorporated into applications to enhance: Geocoding accuracy Risk assessment Risk concentration Many other uses where “granular” accuracy is important What is Parcel Data?
Data Elements Digital Elevation Model (DEM) Satellite Imagery Vegetation Condition Class data Data Granularity Wildfire Risk Determination Wildfire Risk Vegetation Slope 20% of Total Risk Composition Class Topography Aspect Aspect Slope Fuel Load 80% of Total Risk Fuel Wildfire Risk Condition Class Input cell size based on 30m grid All layers sampled at 30m
NC QL2 LiDAR (2014) River Floodplain Floodplain Cross-Section 30m Profile QL2 nearly mirrors existing high precision survey data 10m Profile 4m Profile QL2 – 0.3m Profile Actual Survey Elevations
Severe Convective Storms (SCS) Severe Convective Storms (SCS) refer to Tornado, Hail and Straight Line Wind events Prior to recent events, less attention given to SCS vs Hurricane and Earthquake Tornados and the storms that generate tornados account for more than half of the insured catastrophic losses (57%) that occur each year in the U.S. – and extend beyond “Tornado Alley” Frequency of observed events has increased Growing population Better observational tools (Doppler radar, etc.) Rising global temperature?
Distribution of 2”+ Hail events • 52.4% of Damaging Hail events occur in areas with Extreme Hail Risk levels • 85.6% of Damaging Hail events occur in areas of High, Very High or Extreme Hail Risk; those areas are only 40.7% of the land area of the USA.
Distribution of F2 and above Tornado events 30.3% of F2 and higher events occur in areas with Extreme Tornado Risk levels 84.3% of F2 and above events occur in areas of High, Very High or Extreme Risk; those areas are only 40.0% of the land area of the USA.
Overview - CoreLogic Wildfire Hazard Risk Report Drought conditions (only 5 states in the western U.S. recorded precipitation at or above average in 2012) and high temperatures impact the number of wildfires 67,664 Wildfires in 2012 9,326,000 acres burned in 2012 For 2000-2008, on average over 2,500 structures destroyed each year, compared with less than 1,000 per year for all prior decades Over 1,260,000 residential properties in the western U.S are currently located in High or Very High Wildfire risk areas, with a value of more than $189 billion
Wildfire – Bastrop County, TX Wildfire – Bastrop County, TX
Wildfire – Bastrop County TX % of properties damaged or destroyed, by WF score Wildfire Risk Score summary % of properties damaged increases with Wildfire Risk Score Damage % varies across Very High Risk scores, but increasing
Summary There is an increasing number of events over the past decade Location of recent events seem to follow where the models predict they will occur Hail and Tornado damage extends and causes damage beyond just the traditional Tornado Alley