Download
1 / 19
190 likes | 286 Views
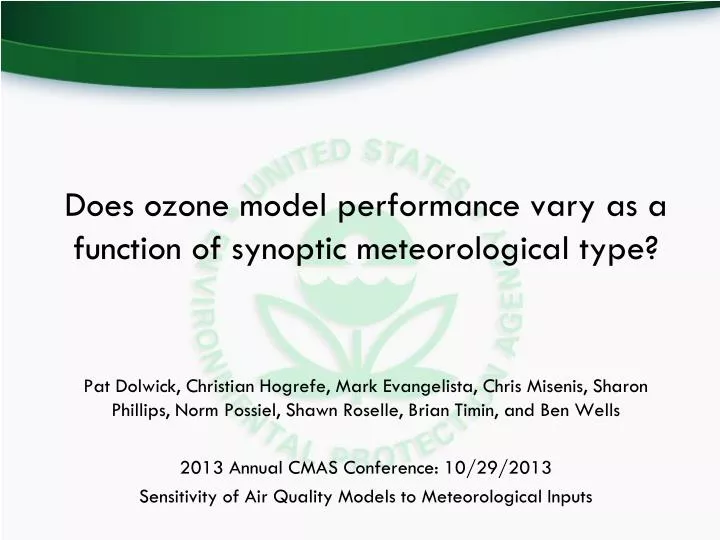
Does ozone model performance vary as a function of synoptic meteorological type?. Pat Dolwick, Christian Hogrefe, Mark Evangelista, Chris Misenis, Sharon Phillips, Norm Possiel, Shawn Roselle, Brian Timin, and Ben Wells 2013 Annual CMAS Conference: 10/29/2013

E N D
Does ozone model performance vary as a function of synoptic meteorological type? Pat Dolwick, Christian Hogrefe, Mark Evangelista, Chris Misenis, Sharon Phillips, Norm Possiel, Shawn Roselle, Brian Timin, and Ben Wells 2013 Annual CMAS Conference: 10/29/2013 Sensitivity of Air Quality Models to Meteorological Inputs
Introduction • While photochemical grid models have improved considerably in their ability to reproduce observed ozone in retrospective simulations over the past two decades, it is not uncommon for substantial biases and errors to exist at specific locations and times. • The goal of this analysis is to assess the value of partitioning days by their meteorological “synoptic type” when evaluating ozone model performance. • If a signal can be found that relates poor model performance to certain synoptic meteorological patterns, then additional attention can be devoted to those specific patterns when the meteorological inputs are prepared. 2
Background • Previous studies have shown some value of binning meteorological patterns into specific synoptic types and assessing how well air quality models capture the sensitivity of air pollution to varying meteorology: • Eder et al., 2006 • Hogrefe et al., 2013 (submitted for publication) • Most of the previous studies have been constrained to relatively short modeling periods, typically one year or less. • This analysis assesses how CMAQ ozone model performance for a multi-year simulation period varies as a function of several discrete mean sea-level pressure patterns over the eastern U.S. 3
Typing Methodology • A climatology of synoptic types were developed for the eastern U.S. based on meteorological data from 1979-2011 • ECMWF reanalysis data (ERA-interim) • Patterns are determined based on mean sea-level pressure patterns • Analysis focuses on warm season (May-September) • A type was established only if > 1% of the days could be assigned to it • Days with MSLP correlations of > 0.7 were assigned to a type • Ultimately, 15 synoptic types were identified to represent the most frequent summer meteorological patterns over the eastern U.S. • 73 percent of days were assigned to a specific type 4
Sample synoptic type: Average conditions • For each of the 15 types we summarized the average meteorological conditions associated with the type • Pattern #1 shown to left • Strong Bermuda high • Was determined to represent 8.3% of days • While averages are smooth, note that day-to-day variations exist within same type
Sample synoptic type: Average O3 anomaly • Additionally, for each of the 15 types we determined the average ozone anomaly associated with the type • Pattern #1 shown on left • Higher than usual ozone in the Northeast US • Because of the improving trend in O3 levels in the EUS over time, anomalies only used days from 2005-2012
Ozone Modeling Methodology • Four years of CMAQ modeling were completed using a national domain with 12-km resolution domain (24 vertical layers) • Four annual simulations were completed for 2007-2010 • CMAQ version 4.7 (specific versions could vary by year) • Emissions are NEI-based (specific versions could vary by year) • WRF meteorology (specific versions/configuration could vary by year) • IC/BC from year-specific GEOS-Chem global model • Modeling and base evaluation summarized more completely at: • http://www.epa.gov/heasd/research/cdc.html. • This additional evaluation (MDA8 bias by synoptic type) uses available AIRS and CASTNET ozone sites w/ 75% data capture during May-Sept periods of 2007 and 2010. 7
Model Performance by Synoptic Type • Plot shows how model performance differs as a function of synoptic type • Distributions of MDA8 residuals (mod-obs) • Warm season: May-Sept • All types exhibit slight overprediction Days that do not fall into one of the 15 identified types are lumped together as “Type 0” days
Model Performance by Synoptic Type • Same plot as before but with smaller scale to draw out subtle differences • Types 4, 10, and 13 tend to feature slightly more positive bias. • Type 15 and the “untyped” days (Type 0) tend to have the least bias.
Model Performance by Synoptic Type/Year • Same plot as before but breaking out MDA8 residual distributions by year • MDA8 O3 residuals are consistent across years • 2009 most overpred • Some interesting type-year dependencies (e.g., 2008 Type 14), but generally consistent
Model Performance by Synoptic Type (only sites w/ large anomalies) • Same plot as before but only considering sites w/ strong anomalies. • Strong anomalies were sites in which there was at least a 15 ppb difference between the most and least conducive synoptic types
Model Performance by Type (high O3 days) • About 5% of the total modeled site-days have observed MDA8 >= 70 ppb • Limiting analysis to these high days indicates model underpredictons are more likely across all synoptic types • Again Type 4 has the highest median value • Least bias in this case • Larger-than-normal spread in residuals
Synoptic Type 4: FROPA through MW
Model performance by type (sample site) • Model biases can vary by a factor of 3 or more across synoptic type • This particular location suggest that model overpredictions are worse when trajectories are associates w/ long fetch from south/east boundary • Confirmed via separate evaluations by upstream trajectory direction
Summary / Next steps • More work needed to assess which sites at which there is a meaningful relationship between synoptic types and model performance. • Early suggestion that approach has potential value. • Will test other periods / domains. • Other possible uses of synoptic typing aside from model performance: • Climate trends • Meteorological adjustment
Screening-level analysis of meteorological severity • By combining recent year ozone anomalies with synoptic type frequencies, one can get a “first-glance” picture of which summers were more/less conducive to ozone formation 1988 2004 2009 2012