Download
1 / 49
510 likes | 709 Views
Chapter 7 The Human Population. Scientists Disagree on Earth’s Carrying Capacity. Figure 7.1. Every 5 days the human population increases by 1 million people Current human population – 7.7 billion people. Scientists Disagree on Earth’s Carrying Capacity.

E N D
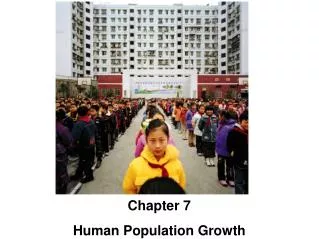
Chapter 7 The Human Population
Every 5 days the human population increases by 1 million people • Current human population – 7.7 billion people
Scientists Disagree on Earth’s Carrying Capacity • The following graphs show theoretical models of food supply and population size.
Scientists Disagree on Earth’s Carrying Capacity • 1798 – Thomas Malthus – human populations grew exponentially while food supply grew linearly. • Population will reach carrying capacity and then decline.
Scientists Disagree on Earth’s Carrying Capacity • Other scientists theorize that growing populations provide a supply of intellect leading to innovation. • Humans can alter the earth’s carrying capacity (ie. Horse-driven plows to harvesters.
Review… • What determines the carrying capacity of a habitat? • How might humans differ from other organisms when it comes to carrying capacity? • Will human exceed Earth’s carrying capacity? What evidence can you use to justify your argument?
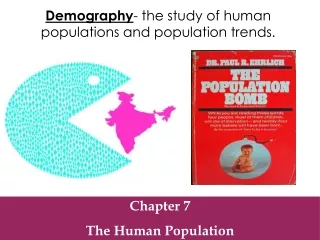
Factors that Drive Human Population Growth • Demography- the study of human populations and population trends. • Changes in Population Size • Fertility • Life Expectancy • Age Structure • Migration
Changes in Population Size • Immigration- the movement of people into a country • Emigration- the movement of people out of a country. • Net migration rate- the difference between immigration and emigration in a given year per 1,000 people in the country.
Changes in Population Size • Crude birth rate (CBR)= the number of births per 1,000 individuals per year. • Crude death rate (CDR)= the number of deaths per 1,000 individuals per year. • Global population growth rate = (CBR- CDR)/ 10 (used to create a %) • National population growth rate = (CBR+ immigration) - (CDR + emigration)/ 10 • Doubling time (in years)- 70/growth rate
The rule of 70 • Doubling time (in years)- 70/growth rate • How long will it take a population with a yearly 2% growth rate to double? • 70/2 = 35 years • Will grow this fast regardless of size
The rule of 70 • Most demographers believe that the human population will be between 8.1 billion and 9.6 billion by 2050 and will stabilize between 6.8 and 10.5 billion by 2100.
Fertility • Total fertility rate- an estimate of the average number of children that each woman in a population will bear. (TFR – 2008 in the US was 2.1) • Replacement level fertility- the total fertility rate required to offset the average number of deaths in a population and for the current population size to remain stable. • Usually just over 2
Fertility • Developed countries- countries with relatively high levels of industrialization and income. (TFR = 2.1) • Developing countries- countries with relatively low levels of industrialization and income of less that $3 per person per day. (TFR = greater than 2.1)
Life Expectancy • Life expectancy- the average number of years that an infant born in a particular year in a particular country can be expected to live, given the current average life span and death rate of that country.
Life Expectancy • Infant mortality rate- the number of deaths of children under 1 year of age per 1,000 live births. • Child mortality rate- the number of deaths of children under age 5 per 1,000 live births.
Life Expectancy • 2009 – (global) IMR = 46 (per 1,000 births) • US = 6.6 • 13.6 –African Americans • 8.1 – Native Americans • 5.8 - Caucasians • Liberia = 99 • Bolivia = 50 Socioeconomic status (environmental justice) Women do not have access to prenatal care
Life Expectancy • Even with high life expectancy and low IMR - a high CDR (crude death rate) is possible due to older individuals. • US – 13% are 65 yrs or older • Mexico - 6% are 65 yrs or older • Disease • Infections diseases 2nd biggest killer worldwide • Today – HIV resopnsible for more deaths annually between TB and Malaria • More disruptive effect on society than other illnesses affeting young and old
Age Structure • Age structure diagrams (population pyramids)- visual representations of age structure within a country for males and females. • Each horizontal bar represents a 5 year age group. • The total area represents the size of the whole population.
Slow population growth rate – developed country Population pyramid – developing countries TFR less than 2.1 – populations will eventually shrink (C,D)
Migration • Countries with low CBR but high immigration may still experience population growth (US) • Net migration rate – difference between the immmigration and emigration in a year per 1,000 people.
Do the Math pg. 187 • New Zealand popn: 4.3 million • TFR: 2.1 • NMR: 2 per 1,000 • How many people will New Zealand gain next year as a result of immigration?
Do the Math pg. 187 • Net migration rate: # of immigrants/ # of people in population 2/1,000 = x/4,300,000 X=8,600 people/year (added each year) Rate of increase? 8,600 people/year 4,300,00 people = 0.2 %/ year
Do the Math pg. 187 • Rule of 70 = 70/% growth = doubling time • What is the doubling time of this population? • 70/0.2 per year = 350 years
Review… • What are the main factors that influence human population growth? • How does age structure infuence the population growth rate? • How do a country’s total fertility rate and net migration rate determine population growth?
The Demographic Transition • Theory that states: as a country moves from a subsistence economy to industrialization and increased affluence, it undergoes a predictable shift in population growth.
The Stages of the Demographic Transition • Phase 1: Slow population growth because there are high birth rates and high death rates which offset each other. • Phase 2: Rapid population growth because birth rates remain high but death rates decline due to better sanitation, clean drinking water, increased access to food and goods, and access to health care. • Phase 3: Stable population growth as the economy and educational system improves and people have fewer children. • Phase 4: Declining population growth because the relatively high level of affluence and economic develop encourage women to delay having children.
Family Planning • Family planning- the regulation of the number or spacing of offspring through the use of birth control.
Review… • What is the theory of demographic transition? • How do education and demographic transition relate to each other? • In what ways are phase 1 and phase 3 in a demographic transition similar?
The relationship between economic development and population growth rate for developing nations.
Developed contries consume more than ½ of the world’s energy and resources. • One person can have 2-10x the impact of those in a developing country. • World’s avg. ecological footprint 2.7 ha (6.7 acres) • US – largest of any nation – 9 ha (22 acres) per capita.
Ecological Footprints • Affluence - having a lot of wealth such as money, goods, or property.
US Ecological Footprint • 2,810 million ha (6,944 acres)
The IPAT Equation • To estimate the impact of human lifestyles on Earth we can use the IPAT equation: • Impact= Population X Affluence X Technology (destructive)
The Impact of Affluence • Gross domestic product (GDP)- the value of all products and services produced in a year in that country. • GDP is made up of consumer spending, investments, government spending, and exports minus imports. • A countries GDP often correlates with its pollution levels. • As GDP goes up pollution can increase
Discuss… • Some scientists argue that increaseing the GDP of developing nations is the BEST way to save the environment… • What do you think?
Review… • What is the IPAT equation? What does it describe? • How do local and global environmental impacts differ? Where do we tend to see one versus the other? • How does a country’s degree of development influence its environmental impact?
How can sustainable development be achieved? • 2005 – Millennium Ecosystem Assessment project • Global analysis of effects of human population on ecosystem services. • Drew several conclusions…
How can sustainable development be achieved? • If human pop. Continues ecosystem sustainability will be threatened • Continued alterations to the ecosystem will exacerbate poverty for some populations • If we establish sustainable practices, we may be able to improve the standard of living for many people.
How can sustainable development be achieved? “human actions are depleting Earth’s natural capital, putting such strain on the environment that the ability of the planet’s ecosystems to sustain further generations can no longer be taken for granted.”
Review • What is the difference between economic development and sustainable development? • How is the Millenium Ecosystem Assessment project a blueprint for sustainable development? • What factors have we discussed that make sustainable development difficult to achieve?
Human Footprint… • http://channel.nationalgeographic.com/channel/human-footprint/consumption-interactive.html