Download
1 / 13
140 likes | 458 Views
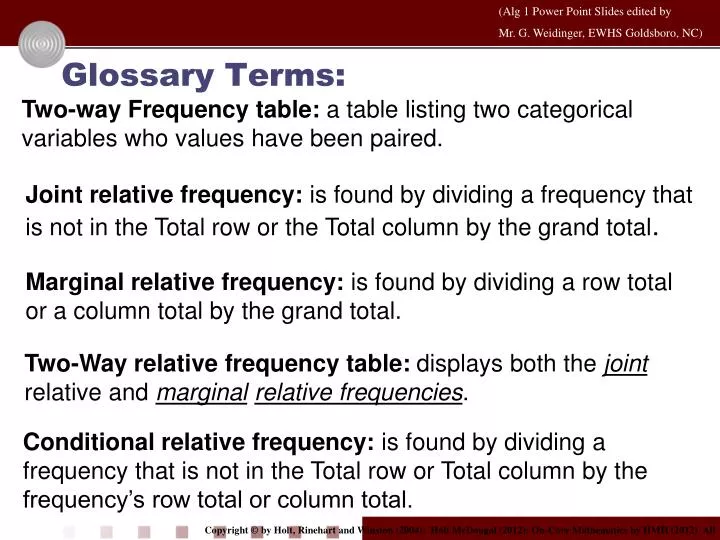
Glossary Terms:. Two-way Frequency table: a table listing two categorical variables who values have been paired. Joint relative frequency: is found by dividing a frequency that is not in the Total row or the Total column by the grand total.

E N D
Glossary Terms: Two-way Frequency table: a table listing two categorical variables who values have been paired. Joint relative frequency: is found by dividing a frequency that is not in the Total row or the Total column by the grand total. Marginal relative frequency: is found by dividing a row total or a column total by the grand total. Two-Way relative frequency table: displays both the joint relative and marginalrelative frequencies. Conditional relative frequency: is found by dividing a frequency that is not in the Total row or Total column by the frequency’s row total or column total.
Old Holt 4-5/4-6; New Holt 10-1/10-2/10-3 On-Core: 9-5 Two Way Frequency Tables Creating a Relative Frequency Table: Jenna asked 40 randomly selected students whether they preferred dogs, cats or other pets. Complete the table for both decimals and percents 18 40 12 40 40 40 10 40 = .45 = .30 = 1.00 = .25 45% 30% 100% 25%
Old Holt 4-5/4-6; New Holt 10-1/10-2/10-3 On-Core: 9-5 Two Way Frequency Tables Creating a Two-Way Frequency Table: Jenna also recorded the gender of each student. The results are shown in the two-way frequency table. Find the totals and answer the questions. 40 18 10 12 40 1) How many total students took the survey? 24 2) How many total boys took the survey? 3) How many students said they like dogs as pets? 18 10 4) How many boys said they like dogs as pets?
Old Holt 4-5/4-6; New Holt 10-1/10-2/10-3 On-Core: 9-5 Two Way Frequency Tables Creating a Two-Way Relative Frequency Table: Jenna also recorded the gender of each student surveyed, complete the two-way frequency table below. 40 18 10 12 5 40 10 40 24 40 9 40 = .125 = .60 = .25 = .225 1 40 7 40 16 40 8 40 = .40 = .175 = .20 = .025 12 40 40 40 18 40 10 40 = 1.00 = .45 = .25 = .30
Old Holt 4-5/4-6; New Holt 10-1/10-2/10-3 On-Core: 9-5 Two Way Frequency Tables Creating a Two-Way Relative Frequency Table: 5 40 10 40 24 40 9 40 = .125 = .60 = .25 = .225 1 40 7 40 16 40 8 40 = .40 = .175 = .20 = .025 12 40 40 40 18 40 10 40 = 1.00 = .45 = .25 = .30 State the percents for the table above. 12.5% 60% 25% 22.5% 2.5% 17.5% 40% 20% 45% 25% 100% 30%
Old Holt 4-5/4-6; New Holt 10-1/10-2/10-3 On-Core: 9-5 Two Way Frequency Tables Creating a Two-Way Relative Frequency Table: 1) Find the joint relative frequency of students surveyed who are girls and prefer dogs as pets. 20% 2) Find the joint relative frequency of students surveyed who are boys and prefer cats as pets. 12.5% 3) Find the marginal RF of students surveyed who prefer dogs as pets and then prefer cats as pets. dogs - 45% cats - 30%
Old Holt 4-5/4-6; New Holt 10-1/10-2/10-3 On-Core: 9-5 Two Way Frequency Tables Calculating a Conditional Relative Frequency: 40 18 10 12 Find the conditional relative frequency that a student surveyed prefers cats as pets, given the student is a girl. Number of girls who prefer cats: 7 = 43.75% = .4375 16 Number of girls:
Old Holt 4-5/4-6; New Holt 10-1/10-2/10-3 On-Core: 9-5 Two Way Frequency Tables Calculating a Conditional Relative Frequency: 40 18 10 12 Find the conditional relative frequency that a student surveyed is a girl, given that the student prefers cats as pets. Number of girls who prefer cats: 7 = .583 = 58.3% 12 Number of students who prefer cats:
Old Holt 4-5/4-6; New Holt 10-1/10-2/10-3 On-Core: 9-5 Two Way Frequency Tables Calculating a Conditional Relative Frequency: 40 18 10 12 Find the conditional relative frequency that a student surveyed prefers cats as pets, given the student is a boy. Number of boys who prefer cats: 5 = 20.8% = .208 24 Number of boys:
Old Holt 4-5/4-6; New Holt 10-1/10-2/10-3 On-Core: 9-5 Two Way Frequency Tables Calculating a Conditional Relative Frequency: 40 18 10 12 Find the conditional relative frequency that a student surveyed is a boy, given that the student prefers dogs as pets. 10 Number of boys who prefer dogs: = .556 = 55.6% 18 Number of students who prefer dogs:
Old Holt 4-5/4-6; New Holt 10-1/10-2/10-3 On-Core: 9-5 Two Way Frequency Tables Graph the Two-Way Relative Frequency Table: Girls Boys What benefit can these graphs provide in analyzing the data? Visual analysis; quicker/faster comparison of the data; scales; colors
Old Holt 4-5/4-6; New Holt 10-1/10-2/10-3 On-Core: 9-5 Two Way Frequency Tables Graph the Two-Way Relative Frequency Table: What benefit can these graphs provide in analyzing the data? Visual analysis, quicker/faster comparison of the data, scales, colors
Old Holt 4-5/4-6; New Holt 10-1/10-2/10-3 On-Core: 9-5 Two Way Frequency Tables Finding Possible Associations and Trends Jenna survey results (numbers vs percents). 1) Does the table reflect gender bias towards pets? NO But, it does imply, boys like “other” pets more than girls: 22.5% to 2.5%, 2) If so, which gender, likes which pets the best? N/A 3) What are some examples of “other” pets? Hamsters, gerbils, mice, rats, snakes, rabbits, pigs, etc., “other” types 4) Girls tend not to like which types of pets?