Download
1 / 41
410 likes | 549 Views
x>1: Short Range Correlations and “Superfast” Quarks Jlab Experiment 02-019. Nadia Fomin University of Tennessee User Group Meeting Jefferson Lab June 9 th , 2010. E02-019 Overview.

E N D
x>1: Short Range Correlations and “Superfast” Quarks Jlab Experiment 02-019 Nadia Fomin University of Tennessee User Group Meeting Jefferson Lab June 9th, 2010
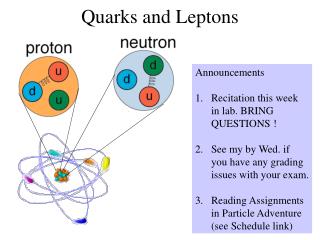
E02-019 Overview • Inclusive Scattering only the scattered electron is detected, cannot directly disentangle the contributions of different reaction mechanisms. • Inclusive Quasielastic and Inelastic Data allows the study of a wide variety of physics topics • Duality • Scaling (x, y, ξ, ψ) • Short Range Correlations – NN force • Momentum Distributions • Q2 –dependence of the F2 structure function
A long, long time ago….in Hall C at JLab • E02-019 ran in Fall 2004 • Cryogenic Targets: H, 2H, 3He, 4He • Solid Targets: Be, C, Cu, Au. • Spectrometers: HMS and SOS (mostly HMS) • Concurrent data taking with E03-103 (EMC Effect – Jason Seely & Aji Daniel)
The inclusive reaction e- e- e- e- M*A-1 M*A-1 MA MA Same initial state Different Q2 behavior DIS QES W2=Mn2 W2≥(Mn+Mπ)2 Spectral function 3He
Inclusive Electron Scattering (x>1)x=1 (x<1) The quasi-elastic contribution dominates the cross section at low energy loss, where the shape is mainly a result of the momentum distributions of the nucleons As ν and Q2 increase, the inelastic contribution grows A useful kinematic variable: JLab, Hall C, 1998 Fraction of the momentum carried by the struck parton A free nucleon has a maximum xbj of 1, but in a nucleus, momentum is shared by the nucleons, so 0 < x < A
Deuterium • Usually, we look at x>1 results in terms of scattering from the nucleon in a nucleus and they are described very well in terms of y-scaling (scattering from a nucleon of some momentum) • Quasielastic scattering is believed to be the dominant process
Deuterium • Usually, we look at x>1 results in terms of scattering from the nucleon in a nucleus and they are described very well in terms of y-scaling (scattering from a nucleon of some momentum) • Quasielastic scattering is believed to be the dominant process
Short Range Correlations => nucleons with high momentum Independent Particle Shell Model : For nuclei, Sα should be equal to 2j+1 => number of protons in a given orbital However, it as found to be only ~2/3 of the expected value The bulk of the missing strength it is thought to come from short range correlations • NN interaction generates high momenta (k>kfermi) • momentum of fast nucleons is balanced by the correlated nucleon(s), not the rest of the nucleus
Short Range Correlations 2N SRC Deuteron 3N SRC Carbon NM
Short Range Correlations • To experimentally probe SRCs, must be in the high-momentum region (x>1) • To measure the probability of finding a correlation, ratios of heavy to light nuclei are taken • In the high momentum region, FSIs are thought to be confined to the SRCs and therefore, cancel in the cross section ratios P_min (GeV/c) x
Short Range Correlations – Results from CLAS Egiyan et al, Phys.Rev.C68, 2003 No observation of scaling for Q2<1.4 GeV2 Egiyan et al, PRL 96, 2006
E02-019: 2N correlations in ratios to Deuterium 18° data Q2=2.5GeV2
E02-019: 2N correlations in ratios to Deuterium 18° data Q2=2.5GeV2 R(A, D)
A/D Ratios: Previous Results 18° data Q2=2.5GeV2 4He R E02-019 NE3 3.87±0.12 56Fe 5.38±0.17
E02-019 2N Ratios 3He 3He 12C 12C
2N correlations in ratios to 3He Can extract value of plateau – abundance of correlations compared to 2N correlations in 3He
2N correlations in ratios to 3He A measure of probability of finding a 2N correlation: Recently learned that this correction is probably not necessary (pn >>pp) In the example of 3He: Hall B results (2003) E02-019 statistical errors only
Q2 (GeV2) CLAS: 1.4-2.6 E02-019: 2.5-3 E02-019 Ratios • Excellent agreement for x≤2 • Very different approaches to 3N plateau, later onset of scaling for E02-019 • Very similar behavior for heavier targets
Q2 (GeV2) CLAS: 1.4-2.6 E02-019: 2.5-3 E02-019 Ratios For better statistics, take shifts on E08-014 • Excellent agreement for x≤2 • Very different approaches to 3N plateau, later onset of scaling for E02-019 • Very similar behavior for heavier targets
E02-019 Kinematic coverage • E02-019 ran in Fall 2004 • Cryogenic Targets: H, 2H, 3He, 4He • Solid Targets: Be, C, Cu, Au. • Spectrometers: HMS and SOS (mostly HMS) • Concurrent data taking with E03-103 (EMC Effect – Jason Seely & Aji Daniel)
On the higher Q2 side of things 2.5<Q2<7.4 2.5<Q2<7.4 Au Jlab, Hall C, 2004 F2A x ξ • In the limit of high (ν, Q2), the structure functions simplify to functions of x, becoming independent of ν, Q2. • As Q2∞, ξx, so the scaling of structure functions should also be seen in ξ, if we look in the deep inelastic region. • However, the approach at finite Q2 will be different. • It’s been observed that in electron scattering from nuclei, the structure function F2, scales at the largest measured values of Q2 for all values of ξ
SLAC, NE3 Jlab, E89-008 Q2 -> 0.44 - 2.29 (GeV/c2) Q2 -> 0.44 – 3.11(GeV/c2)
ξ-scaling: is it a coincidence or is there meaning behind it? • Interested in ξ-scaling since we want to make a connection to quark distributions at x>1 • Improved scaling with x->ξ, but the implementation of target mass corrections (TMCs) leads to worse scaling by reintroducing the Q2 dependence
ξ-scaling: is it a coincidence or is there meaning behind it? • Interested in ξ-scaling since we want to make a connection to quark distributions at x>1 • Improved scaling with x->ξ, but the implementation of target mass corrections (TMCs) leads to worse scaling by reintroducing the Q2 dependence • TMCs – accounting for subleading 1/Q2 corrections to leading twist structure function Following analysis discussion focuses on carbon data
From structure functions to quark distributions • 2 results for high x SFQ distributions (CCFR & BCDMS) • both fit F2 to e-sx, where s is the “slope” related to the SFQ distribution fall off. • CCFR: s=8.3±0.7 (Q2=125 GeV/c2) • BCMDS: s=16.5±0.5 (Q2: 52-200 GeV/c2) • We can contribute something to the conversation if we can show that we’re truly in the scaling regime • Can’t have large higher twist contributions • Show that the Q2 dependence we see can be accounted for by TMCs and QCD evolution
CCFR BCDMS
How do we get to SFQ distributions • We want F2(0), the massless limit structure function as well as its Q2dependence Schienbein et al, J.Phys, 2008
Iterative Approach • Step 1 – obtain F2(0)(x,Q2) • Choose a data set that maximizes x-coverage as well as Q2 • Fit an F2(0), neglecting g2 and h2 for the first pass • Use F2(0)-fit to go back, calculate and subtract g2,h2, refit F2(0), repeat until good agreement is achieved. • Step 2 – figure out QCD evolution of F2(0) • Fit the evolution of the existing data for fixed values of ξ (no good code exists for nuclear structure evolution, it seems)
θHMS Q2(x=1) Cannot use the traditional W2>4GeV/c2 cut to define the DIS region Don’t expect scaling around the quasielastic peak (on either side of x=1)
Fit log(F20) vs log(Q2) for fixed values of ξ to • p2,p3 fixed • p1 governs the “slope”, or the QCD evolution. • fit p1 vs ξ ξ=0.5 ξ=0.75 Q2 • Use the QCD evolution to redo the F20 fit at fixed Q2 and to add more data (specifically SLAC)
P1 parameter vs ξ, i.e. the QCD evolution F20 fit with a subset of E02-019 and SLAC data Final fit at Q2=7 GeV2
Putting it all Together • With all the tools in hand, we apply target mass corrections to the available data sets • With the exception of low Q2 quasielastic data – E02-019 data can be used for SFQ distributions E02-019 carbon SLAC deuterium BCDMS carbon
Putting it all Together • With all the tools in hand, we apply target mass corrections to the available data sets • With the exception of low Q2 quasielastic data – E02-019 data can be used for SFQ distributions E02-019 carbon SLAC deuterium BCDMS carbon | CCFR projection (ξ=0.75,0.85,0.95,1.05)
Final step: fit exp(-sξ) to F20 and compare to BCDMS and CCFR BCDMS CCFR CCFR – (Q2=125GeV2) s=8.3±0.7 BCDMS – (Q2: 52-200 GeV2) s=16.5±0.5 s=15.05±0.5
Analysis repeated for other targets All data sets scaled to a common Q2 (at ξ=1.1)
Summary • Short Range Correlations • ratios to deuterium for many targets with good statistics all the way up to x=2 • different approach to scaling at x>2 in ratios to 3He than what is seen from CLAS • Future: better/more data with 3He at x>2 in Hall A (E08-014) • “Superfast” Quarks • Once we account for TMCs and extract F20 – we find our data is in the scaling regime and can be compared to high Q2 results of previous experiments • appears to support BCDMS results • TO DO: check our Q2 dependence against pQCD evolution • Follow-up experiment approved with higher energy (E12-06-105)
Greater disagreement in ratios of heavier targets to 3He Show?