Download
1 / 38
380 likes | 639 Views
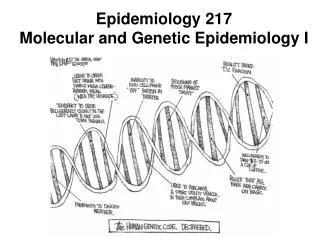
Epidemiology 217 Molecular and Genetic Epidemiology I. Course Director: John Witte Professor of Epidemiology & Biostatistics. Outline. Class Details Introduction to Molecular and Genetic Epidemiology: an example Notes on Human Genetics

E N D
Epidemiology 217Molecular and Genetic Epidemiology I Course Director: John Witte Professor of Epidemiology & Biostatistics
Outline • Class Details • Introduction to Molecular and Genetic Epidemiology: an example • Notes on Human Genetics • Determining the genetic component to disease before looking at DNA • Experiment
I. Details • Classes: 10 Tuesdays, 1:15-2:45 pm • Office hours: by appointment • Course Director: John S. Witte, PhDPhone: 415-502-6882email: wittej@humgen.ucsf.edu • Teaching Assistant: Nerissa Ko, MDPhone: 415-353-1489email: kon@ucsfmedctr.org • Course website: www.epibiostat.ucsf.edu/courses/schedule/mol_methodsi.html
Goals • Learn about: • common molecular and genetic measures • determining the genetic contribution to disease • searching for disease-causing genes, and their interaction with environmental factors • pharmacogenomics; proteomics; and bioinformatics. • Main goal: develop a framework for interpreting, assessing, and incorporating molecular and genetic measures in your own research.
Homework Assignments • Count for 70% of grade (30% for final exam). • Weekly readings and / or brief problem sets. • Readings give important background information, and should be completed before the start of the corresponding lecture. • Problem sets are due at 8 pm on Mondays, so we can discuss the following day. • Late assignments are not accepted.
Web Resources • Video from UAB Short course on statistical genetics: http://www.soph.uab.edu/ssg_content.asp?id=1174 • Dorak’s notes on genetics: http://dorakmt.tripod.com/genetics/ • Strachan & Read’s Human Molecular Genetics: http://www.ncbi.nlm.nih.gov/books/bv.fcgi?rid=hmg
II. Introduction: how was lunch? ? Impact of folate, B12, and homocysteine on cognitive function?
How can we measure these factors? Problems?
Can we improve our measurements? Look at circulating levels in plasma
What else will impact these levels? • Methylene tetrahydrofolate reductase (MTHFR): e.g., catalyzes the last step in conversion of folic acid to its active form, 5-methyltetrahydrofolate (5MTHF).
MTHFR gene Locus • Single nucleotide polymorphisms (SNPs) in MTHFR: C677T (C and T are alleles; CC, CT, TT are genotypes) A1298C (A and C are alleles; AA, AC, CC are genotypes) • E.g., if an individual is homozygous for the 677TT SNP, MTHFR enzymatic activity can decrease by 50%. • This may in turn reduce cognitive function.
Diet, plasma, & genotype interaction • Look at how these work in conjunction with each other to affect cognitive functioning!
Human Chromosome 21 Telomeres Centromere p stands for petit q stands for grand 21q22.1 is pronounced twenty-one q two two point one
Human Genome Statistics • 3,253,037,807 basepairs • 21,774 known genes • 1,036 novel genes • 1,069 pseudogenes • 3,976 RNA genes • 270,661 exons http://www.ensembl.org/Homo_sapiens/index.html
Potentially Functional Regions of a Gene cis regulator promoter Amino acid coding RNA processing Transcription regulation
Human Genome Variation • 3,253,037,807 basepairs • Mutation rate ≈ 10-8 per bp per generation • 65 new mutations expected in each person • Compare two copies in any one person • 1 variant per 1,331 basepairs • 2,444,055 variants • Most variants are old
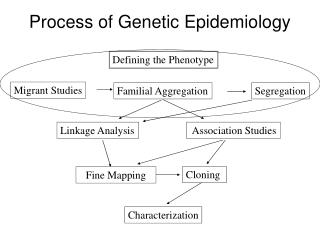
IV. How can we tell that a disease is genetic? • Without looking at DNA… • Ecologic Studies (Migrant Studies) • Familial Aggregation: • Family Studies • Twin Studies • Segregation analyses
Break: How about you? • Research interests? • Background / training in molecular / genetics? • Ever used or considered using molecular or genetic measures in clinical research?
IV.1 Ecologic Studies (Migrant) Weeks, Population. 7th ed. London: Wadsworth Publishing Co 1999
Example: Cancer (SMRs) (MacMahon B, Pugh TF. Epidemiology: Principles and Methods. Boston: Little, Brown and Co, 1970:178.)
IV.2 Familial Aggregation • Does disease tend to run in families? • Example: Men who have a brother or father with prostate cancer have 2-3 times the risk of men without a family history. • Possible study designs: • Case-control: compare the family history between cases versus controls. • Cohort: view the family members of the cases and controls as two cohorts, one exposed (i.e., to a case), the other not exposed.
MZ Twins (Identical) Twin 1 Both alleles are shared identical by descent (IBD) Twin 2
DZ Twins (Fraternal) Twin 1 Twin 2 can be any of the four IBD can be 2, 1, or 0 2 1 1 0
DZ Twins (Fraternal) Twin 1 Average sharing is 50% 100% 50% 50% 0%
Twin Studies • Compare the disease concordance rates of MZ (identical) and DZ (fraternal) twins. Twin 1 Concordance = 2A/(2A+B+C) Twin 2 Then one can estimate heritability (the proportion of the variance of an underlying disease liability due to common genes), and environmentality.
Example of Twin Study: Prostate Cancer • Twin registry (Sweden, Denmark, and Finland) • 7,231 MZ and 13,769 DZ Twins (male) Heritability: 0.42 (0.29-0.50) Non-shared Environment: 0.58 (0.50-0.67) Lichtenstein et al NEJM 2000 13;343:78-85.
IV.3 Segregation Analysis • Evaluate whether the pattern of disease among relatives is compatible with a single major gene, polygenes, or simply shared environment. • Fit formal genetic models to data on disease phenotypes of family members. • The parameters of the model are generally fitted finding the values that maximize the probability (likelihood) of the observed data. • If there appears to be a single major gene, then one can estimate its dominance, penetrance, and allele frequency.
First PTC Family Study L. H. Snyder Science 1931
Summary • Molecular measures can improve upon conventional questionnaire-based measurements. • Genetics can impact many exposures and diseases. • We can assess the heritability with studies of populations and families, including: • Migrant studies • Familial aggregation studies • Family/Twin studies • Segregation analyses